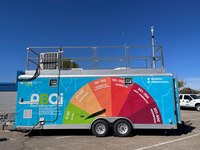
images
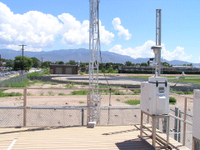
350010023east.gif
View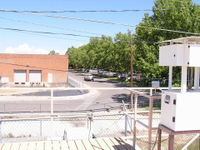
350010023North.gif
View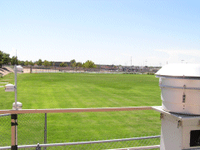
350010023south.gif
View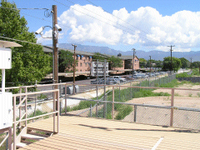
350010023NorthEast.gif
View
dust9_000.gif
View
AQI_000.gif
View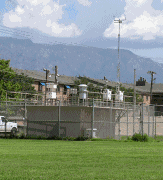
350010023Site.gif
View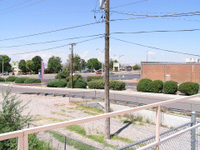
350010023northwest.gif
View
chenopod1.gif
View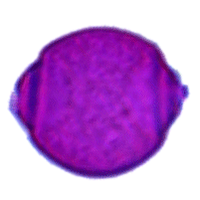
morus1.gif
View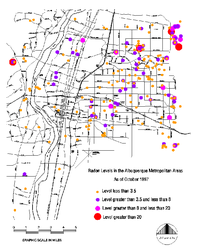
abqradon1a.gif
View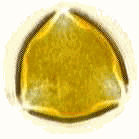
ash.gif
View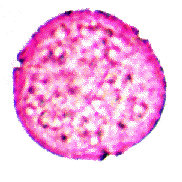
Sorrel.gif
View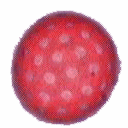
chenopod.gif
View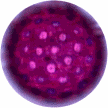
chenopod2.gif
View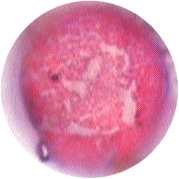
cottonwood.jpg
View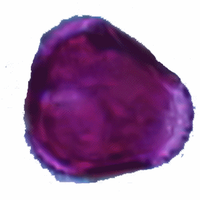
sycamore.gif
View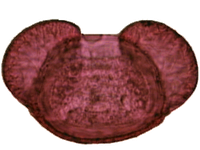
pine2a_000.gif
View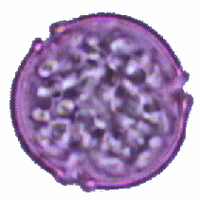
rumex3x.gif
View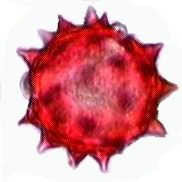
asteraceae_000.jpg
View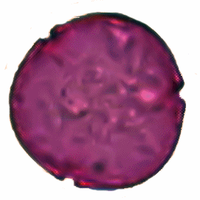
rumex3xa.gif
View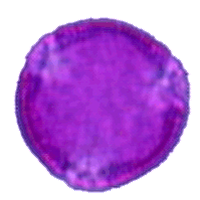
sycamore1.gif
View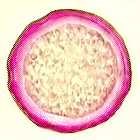
elm.jpg
View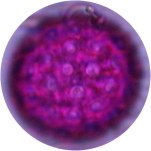
chenopod1a.jpg
View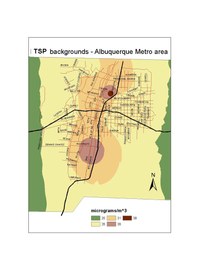
tspmetro.jpg
View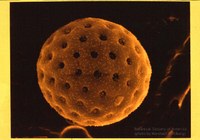
bsachenopod.jpg
View
grass.jpg
View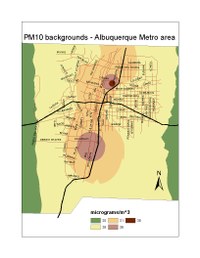
pm10metro.jpg
View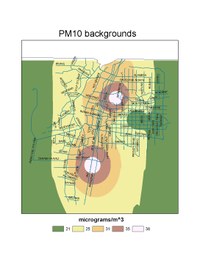
pm10backgroundswithstreets.jpg
Viewburnwiselogosmall.gif
View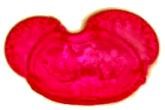
pine1.jpg
View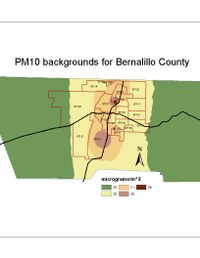
pm10county.jpg
View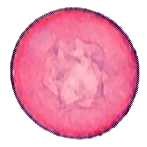
Juniper_001.jpg
View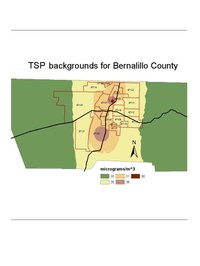
tspcounty.jpg
View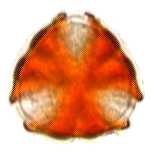
Phaceliacrenulata2.jpg
View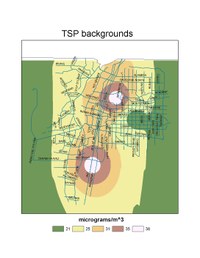
tspbackgroundswithstreets.jpg
View
sycamore1.jpg
View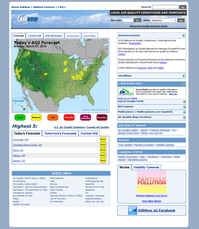
Air Now website
View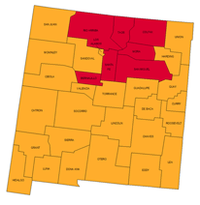
Radon map of New Mexico
View
willow.jpg
View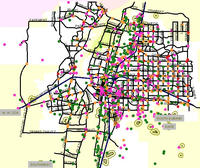
Air pollution sources in Albuquerque
View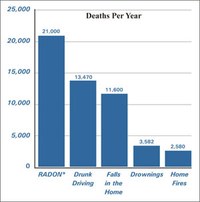
Radon deaths per year
Viewburnicon.jpg
View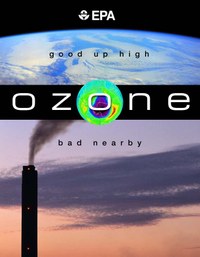
Ozone: Good Up High, Bad Nearby
View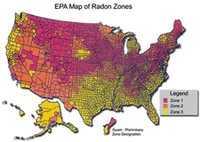
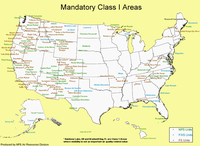
Areas protected by the EPA's Regional Haze Rule
View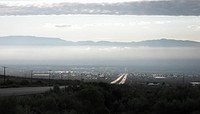
Inversion Layer over Albuquerque
View
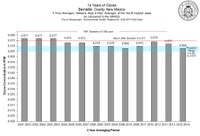
AirData for New Mexico
View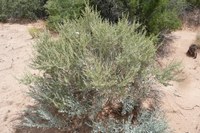

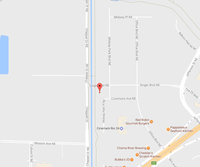
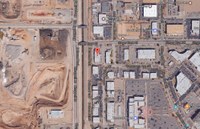
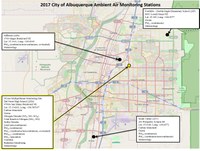
City of Albuquerque Ambient Air Monitoring Stations
City of Albuquerque Ambient Air Monitoring Stations
View
Air_Quality_File_a_Complaint
View
Sulfur Dioxide in the Southwest
A line graph showing Average Sulfur Dioxide Design Values in Albuquerque compared to EPA Southwest Region (8 sites). The national standard is 75 ppb. Albuquerque and the regional average stay below this standard with Albuquerque staying in the "good" zone the entire time.
View
Nitrogen Dioxide in the Southwest
A line graph showing Average Nitrogen Dioxide Design Values in Albuquerque compared to EPA Southwest Region (17 sites). The national standard is 100 ppb. Albuquerque and the regional average stay this standard the entire time, going into the good zone in 2009.
View
Ozone in the Southwest
A line graph showing Average Ozone Design Values in Albuquerque compared to EPA Southwest Region (90 sites). The national standard is 0.070 ppm. Albuquerque and the regional average fluctuate above and below this standard but Albuquerque stays below this more often.
View
PM10 in the Southwest
A line graph showing Average Particulate Matter Concentration in Albuquerque compared to EPA Southwest Region (59 sites). The national standard is 150. Albuquerque and the regional average stay below this most of the time but Albuquerque spikes above in 2012, 2020, and 2022.
View
PM2.5 in the Southwest
A line graph showing Average Fine Particulate Matter Concentration Values in Albuquerque compared to EPA Southwest Region (35 sites). The national standard is 9. Albuquerque is below this standard the whole time, the regional standard stars slightly above it then drops below in 2003.
View
Carbon Monoxide in the Southwest
A line graph showing Average Carbon Monoxide Design Values in Albuquerque compared to EPA Southwest Region (16 sites). The national standard is 9 ppm. Albuquerque and the regional average are below this in the "Good" zone for the entire time.
View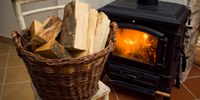
Wood Burning Exemptions
View


AQP - Asbestos.jpg
View
AQP - Fugitive Dust.jpg
View
AQP - Open Burn.jpg
View
AQP - Stationary Source.jpg
View
Bandelier2.jpg
View
Section Block_Air Board
View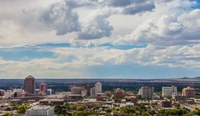
Section Block_About AQP
View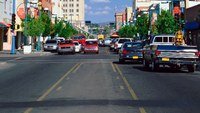
Section Block_VPMD
View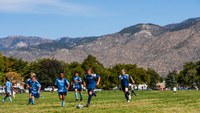
Section Block_Regulation Development
View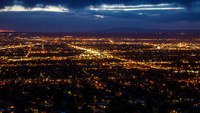
Section Block_Permitting
View
Clean Cars NM NMED+CABQ logo
View

Air Quality Program Logo 2021
View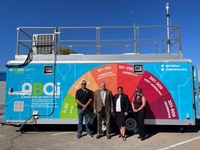
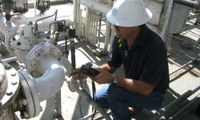
Monitoring Team + Trailer
View