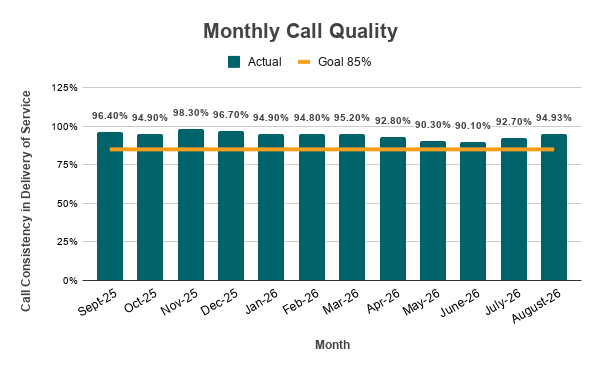
Monthly Call QualityA bar graph showing the Monthly call quality for 311 calls over the past year compared to the 85% goal. The actual quality is between a low of 90.1% in June 2026 and a high of 98.3% in Nov. 2025. Data is in the table below.https://www.cabq.gov/311/images/monthly-call-quality/viewhttps://www.cabq.gov/311/images/monthly-call-quality/@@images/image-1200-6e41c1bd472d0069e873491efafab175.pngMonthly Call QualityA bar graph showing the Monthly call quality for 311 calls over the past year compared to the 85% goal. The actual quality is between a low of 90.1% in June 2026 and a high of 98.3% in Nov. 2025. Data is in the table below.https://www.cabq.gov/311/images/monthly-call-quality/viewhttps://www.cabq.gov/++resource++plone-logo.svg
Monthly Call Quality
A bar graph showing the Monthly call quality for 311 calls over the past year compared to the 85% goal. The actual quality is between a low of 90.1% in June 2026 and a high of 98.3% in Nov. 2025. Data is in the table below.