images
311 Logo
Non-emergency city services...311 Citizen Contact Center. City of Albuquerque seal on the top right of the image.
View

ABQ311 Section Block for 311
A jpg of the ABQ311 section block for 311, featuring a collage of profile photos of 6 311 employees smiling at the camera in front of a blue paper background with cut-out yellow stars.
View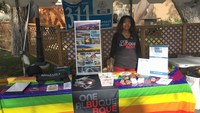
Outreach Services Section Block for 311
A 311 booth outside with various posters and print materials and a woman wearing a One Albuquerque shirt smiling at the camera.
View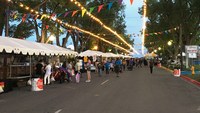
Visitor Section Block for 311
A jpg of the Visitor section block for 311, featuring a group of people at the state fair, browsing shops along a concrete road lined with trees and decorated with strands of lights and colorful flags.
View
Survey Section Block
An image with the text Let your voice be heard make 311 even better take the survey
View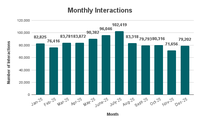
Monthly Interactions
A bar graph showing the 311 Monthly Call Arrival for the past 12 months showing Call volumes mostly in the 80,000s with some in the 70,000 range for the colder months. Call volumes are at a low of 71,656 in Nov. 2025 and peaked in July 2025 with 102,419. Data in the table below.
View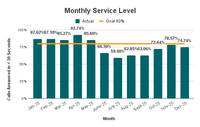
Monthly Service Level
A bar graph showing percentages for the Monthly Service Level over the past year compared to the 80% goal. Every month up to May 2025 was over the goal, June 2025 and after percentages are under the goal. The highest percentage was 92.74% in April 2024 and the lowest was 59.4% in July 2025. Data is in the table below.
View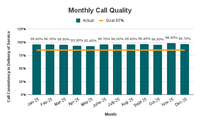
Monthly Call Quality
A bar graph showing the Monthly call quality for 311 calls over the past year compared to the 85% goal. The actual quality is between 92.4% and 98.3% with a low of 92.4% in May 2025 and a high of 98.3% in Nov. 2025. Data is in the table below.
View