Monthly InteractionsA bar graph showing the 311 Monthly Call Arrival for the past 12 months showing Call volumes mostly in the 70,000 to 80,000s. Call volumes are at a low of 69,273 in Feb. 2026 and peaked in July 2025 with 102,419. Data in the table below.https://www.cabq.gov/311/images/monthly-call-arrival/viewhttps://www.cabq.gov/311/images/monthly-call-arrival/@@images/image-1200-78a9da80c718f363b08881b45996525d.pngMonthly InteractionsA bar graph showing the 311 Monthly Call Arrival for the past 12 months showing Call volumes mostly in the 70,000 to 80,000s. Call volumes are at a low of 69,273 in Feb. 2026 and peaked in July 2025 with 102,419. Data in the table below.https://www.cabq.gov/311/images/monthly-call-arrival/viewhttps://www.cabq.gov/++resource++plone-logo.svg
Monthly Interactions
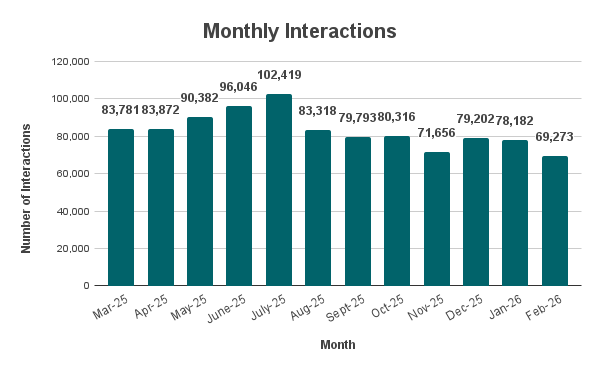
A bar graph showing the 311 Monthly Call Arrival for the past 12 months showing Call volumes mostly in the 70,000 to 80,000s. Call volumes are at a low of 69,273 in Feb. 2026 and peaked in July 2025 with 102,419. Data in the table below.
This link will take you to a site over which the City of Albuquerque has no control. The City assumes no responsibility for the content of the material contained at that site or for the accuracy of any information that is found there. The contents of any site or link not maintained by the City does not necessarily reflect the opinions, standards or policies of the City of Albuquerque, its officials, agents or employees.


