Performance Reports
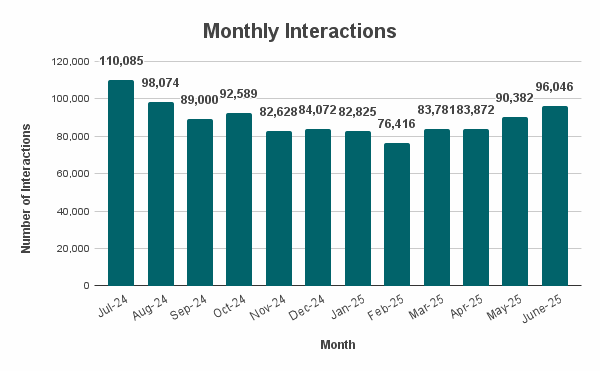
Monthly Interactions Handled
Interactions: Total number of interactions with the Community Contact Center on a monthly basis.

| Month and Year | Number of Interactions |
|---|---|
| July 2024 | 110,085 |
| Aug. 2024 | 98,074 |
| Sept. 2024 | 89,000 |
| Oct. 2024 | 92,589 |
| Nov. 2024 | 82,628 |
| Dec. 2024 | 84,072 |
| Jan. 2025 | 82,825 |
| Feb. 2025 | 76,416 |
| March 2025 | 83,781 |
| April 2025 | 83,872 |
| May 2025 | 90,382 |
| June 2025 | 96,046 |
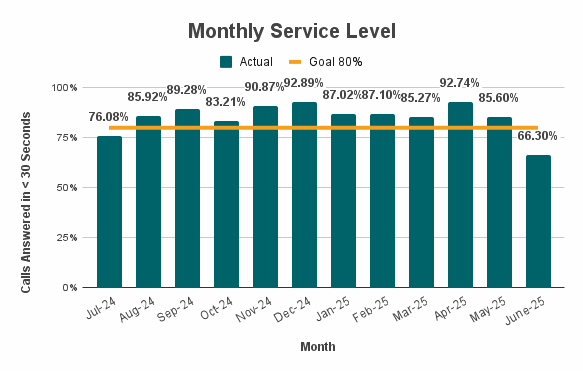
Monthly Service Level
Service Level: A measurement of the percentage of calls that are answered within a specific time frame. The goal for all calls is 80% answered in less than 30 seconds.

| Month and Year | % Calls Answered in Under 30 Seconds |
|---|---|
| July 2024 | 76.08% |
| Aug. 2024 | 85.92% |
| Sept. 2024 | 89.28% |
| Oct. 2024 | 83.21% |
| Nov. 2024 | 90.87% |
| Dec. 2024 | 92.89% |
| Jan. 2025 | 87.02% |
| Feb. 2025 | 87.1% |
| March 2025 | 85.27% |
| April 2025 | 92.74% |
| May 2025 | 85.60% |
| June 2025 | 63.3% |
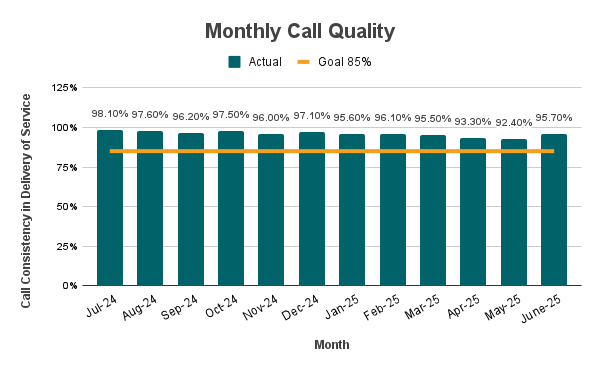
Monthly Call Quality
Call Quality: Consistency in the delivery of service to each and every citizen.
Call quality is measured against a call quality guide developed by all levels of the organization that is reviewed quarterly and revised based on current trends. The goal is to reach a minimum of 85% each month.

| Month and Year | % Call Quality |
|---|---|
| July 2024 | 98.10% |
| Aug. 2024 | 97.6% |
| Sept. 2024 | 96.2% |
| Oct. 2024 | 97.5% |
| Nov. 2024 | 96.00% |
| Dec. 2024 | 97.10% |
| Jan. 2025 | 95.6% |
| Feb. 2025 | 96.1% |
| March 2025 | 95.5% |
| April 2025 | 93.3% |
| May 2025 | 92.40% |
| June 2025 | 95.7% |
Top 10 Call Reasons
Top 10 reasons for June 2025 calls to 311 Community Contact Center:
- Solid Waste Management - 26,503
- Transit - 9,788
- Animal Welfare - 5,169
- Municipal Development - 2,938
- Planning - 2,933
- Police - 2,339
- Parks and Recreation - 1,722
- Arts & Culture - 1,260
- Albuquerque Community Safety - 1093
- Technology & Innovation - 978
There were 3,886 non-City calls and 4,423 dead air, hangup, static, or wrong-number calls.
