Risk Management Claims Paid
Information about claims paid by the City of Albuquerque each year.
Claims Paid: About
The data from Risk Management displayed here is for Fiscal Years 2017 through 2026 (through December 31, 2025). It does not include claims involving damage to City property or liability claims at the Albuquerque Sunport as these risks are transferred through insurance policies.
Note: Public Official Liability includes a settlement paid during Fiscal Year 2023 for an employee class action lawsuit.
Paid amounts shown for more recent years will continue to grow until all claims are closed.
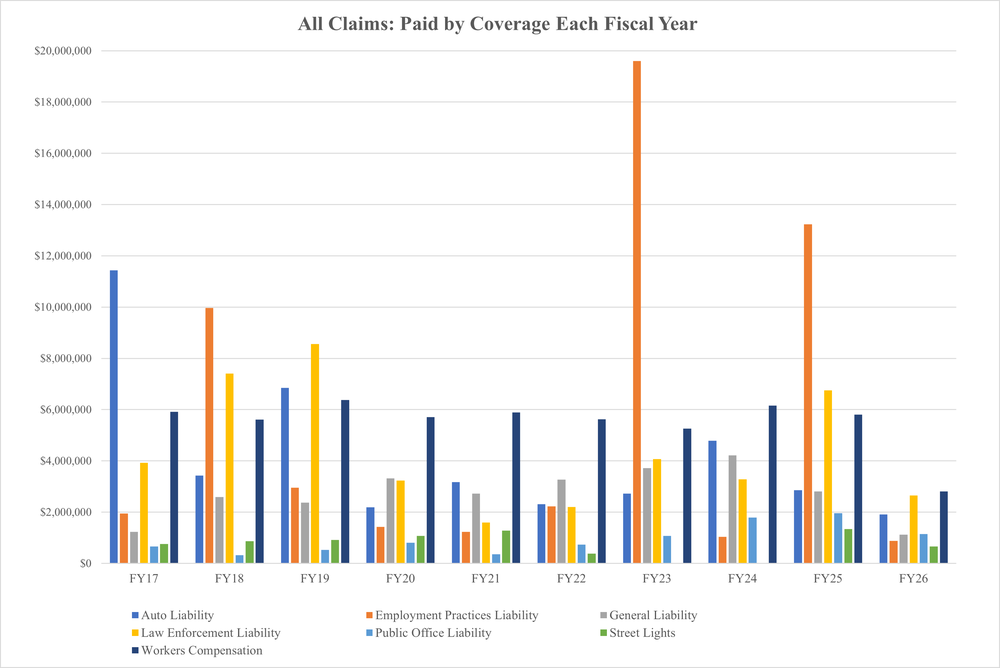
Graph: All Claims Paid
NOTE: The Amounts are Reduced for Subrogations\Recoveries.

Table: All Claims Paid
NOTE: The Amounts are Reduced for Subrogations\Recoveries.
| Fiscal Year | Auto Liability | Employment Practices Liability | General Liability | Law Enforcement Liability | Public Office Liability | Street Lights | Workers Compensation |
|---|---|---|---|---|---|---|---|
| FY17 | $11,439,429 | $1,948,571 | $1,228,777 | $3,924,367 | $656,818 | $762,923 | $5,908,602 |
| FY18 | $3,425,040 | $9,967,263 | $2,591,177 | $7,408,227 | $324,766 | $861,019 | $5,606,546 |
| FY19 | $6,842,855 | $2,947,364 | $2,375,494 | $8,555,581 | $522,023 | $911,711 | $6,377,851 |
| FY20 | $2,191,978 | $1,424,878 | $3,315,152 | $3,226,842 | $803,961 | $1,067,434 | $5,711,334 |
| FY21 | $3,167,123 | $1,230,616 | $2,725,297 | $1,592,956 | $356,766 | $1,275,689 | $5,894,252 |
| FY22 | $2,310,681 | $2,224,516 | $3,267,958 | $2,199,561 | $730,503 | $379,488 | $5,618,012 |
| FY23 | $2,720,384 | $19,594,020 | $3,718,385 | $4,066,174 | $1,068,759 | $17,674 | $5,255,453 |
| FY24 | $4,789,699 | $1,039,548 | $4,215,074 | $3,279,882 | $1,791,424 | $17,531 | $6,152,089 |
| FY25 | $2,861,228 | $13,234,200 | $2,804,376 | $6,755,399 | $1,959,805 | $1,342,274 | $5,800,271 |
| FY26 | $1,913,889 | $878,933 | $1,121,183 | $2,655,360 | $1,150,147 | $660,078 | $2,804,305 |
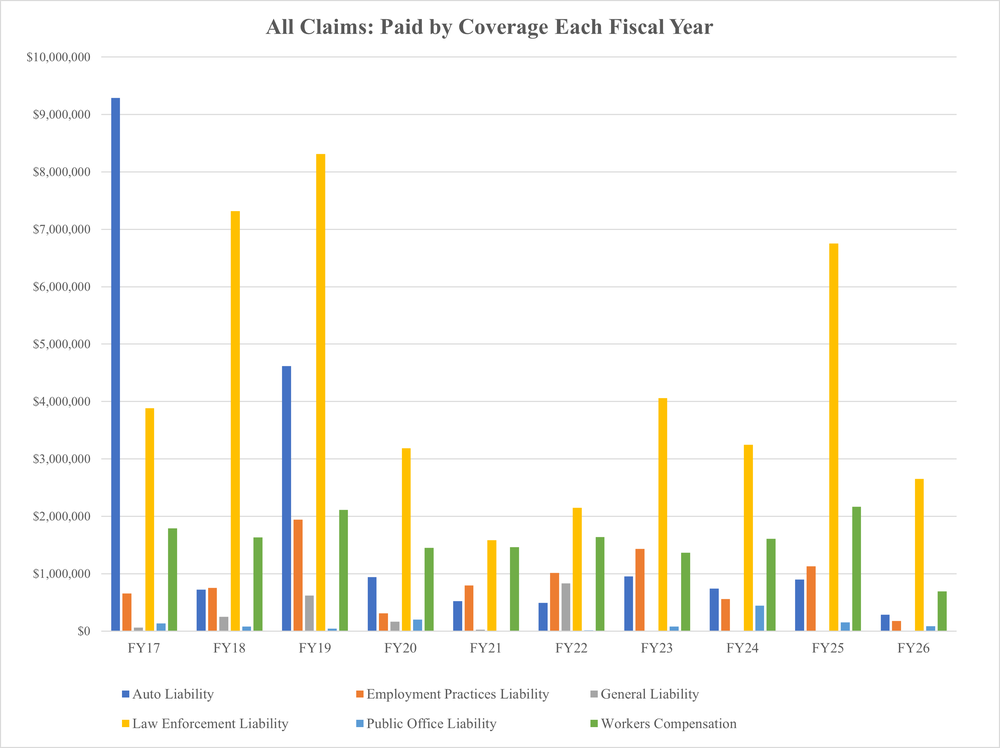
Graph: ABQ Police Only Claims Paid
NOTE: The Amounts are Reduced for Subrogations\Recoveries.

Table: ABQ Police Only Claims Paid
NOTE: The Amounts are Reduced for Subrogations\Recoveries.
| Fiscal Year | Auto Liability | Employment Practices Liability | General Liability | Law Enforcement Liability | Public Office Liability | Workers Compensation |
|---|---|---|---|---|---|---|
| FY17 | $9,290,713 | $658,374 | $63,961 | $3,884,703 | $132,150 | $1,787,621 |
| FY18 | $725,643 | $754,661 | $249,404 | $7,319,405 | $80,365 | $1,633,465 |
| FY19 | $4,615,767 | $1,939,761 | $617,301 | $8,312,754 | $42,599 | $2,114,823 |
| FY20 | $942,242 | $309,701 | $167,146 | $3,185,804 | $203,970 | $1,452,661 |
| FY21 | $523,705 | $793,747 | $25,599 | $1,585,712 | $9,942 | $1,462,702 |
| FY22 | $493,343 | $1,014,822 | $829,691 | $2,148,096 | $15,852 | $1,641,673 |
| FY23 | $951,267 | $1,430,824 | $3,587 | $4,059,521 | $77,877 | $1,363,821 |
| FY24 | $741,424 | $559,528 | $9,463 | $3,245,262 | $440,806 | $1,611,108 |
| FY25 | $900,738 | $1,128,264 | $945 | $6,751,034 | $154,263 | $2,168,635 |
| FY26 | $287,555 | $179,683 | $31 | $2,654,899 | $84,766 | $694,531 |
