All Claims Paid Graph
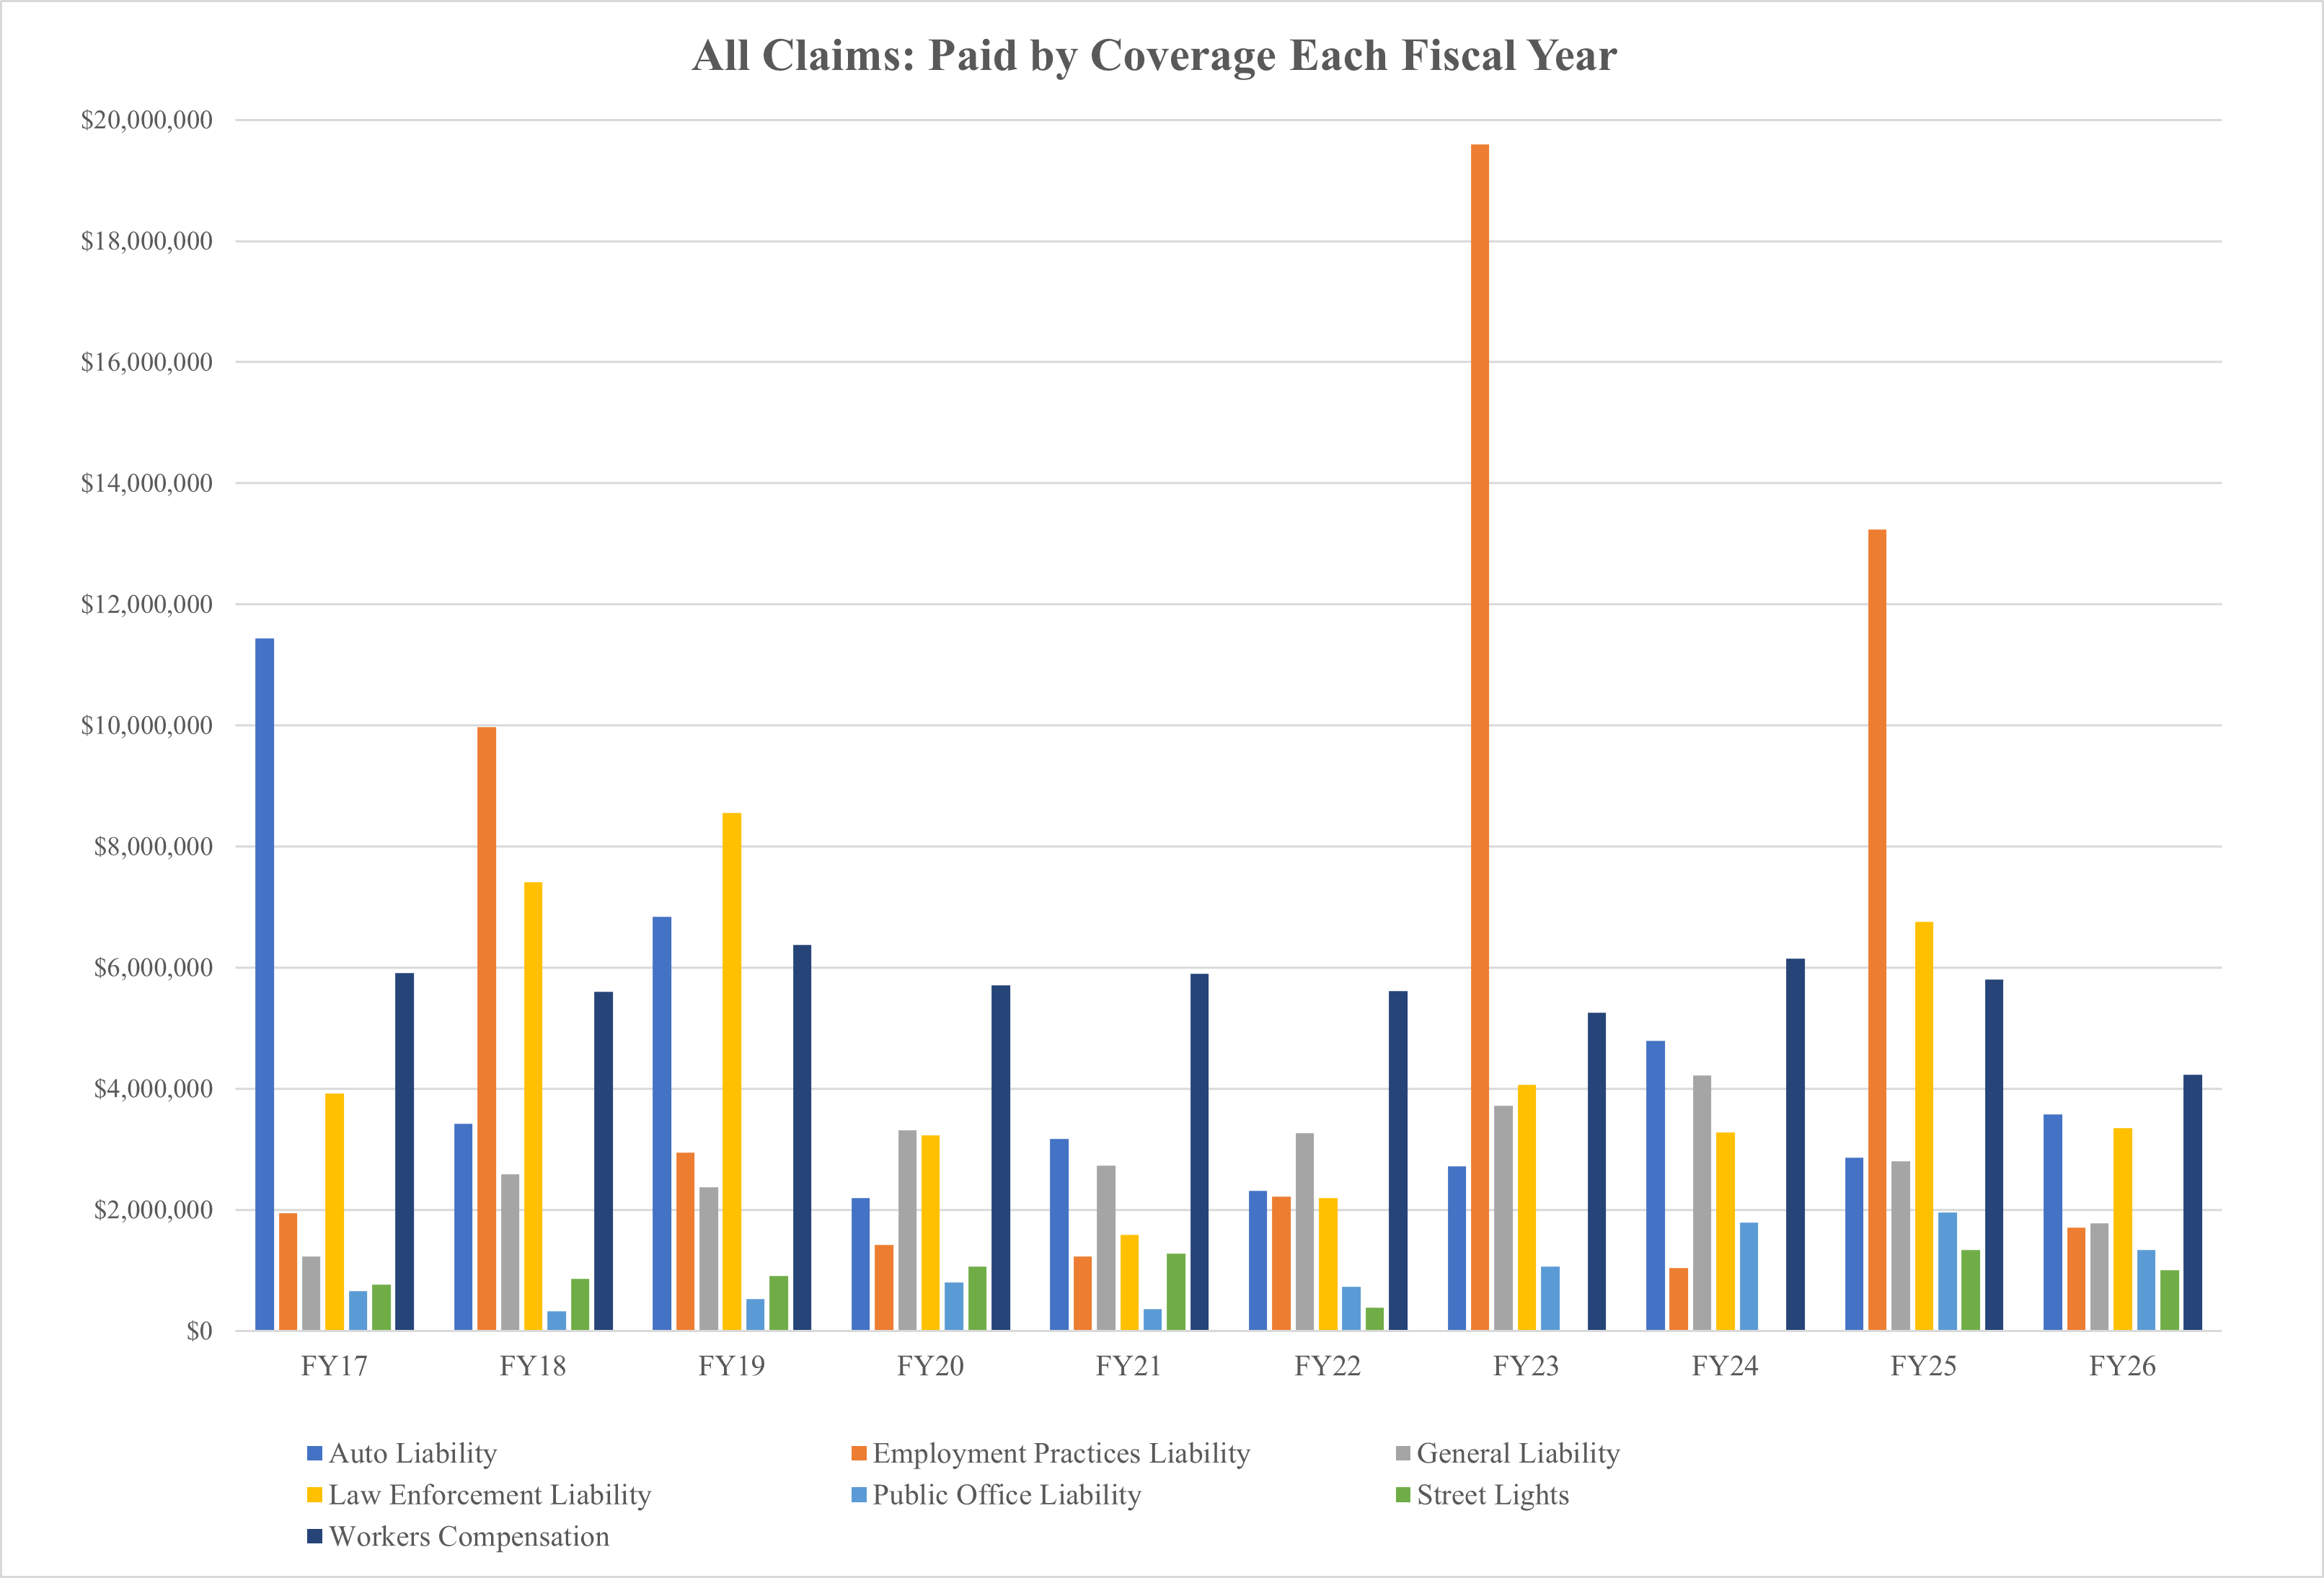
All Claims Paid bar graph showing the amount of claims paid by coverage type for each fiscal year from 2017 to 2026. Data in table below. Updated April 16, 2026.

All Claims Paid bar graph showing the amount of claims paid by coverage type for each fiscal year from 2017 to 2026. Data in table below. Updated April 16, 2026.
