Camera Data
Find data for each of the Automated Speed Enforcement (ASE) Cameras.
City of Albuquerque Automated Speed Enforcement Camera Passing Data
Automated speed enforcement cameras are a proven traffic safety intervention. Each camera deployed through the Automated Speed enforcement program captures continuous passing data. This data allows the city to study driver behavior over time and camera efficacy. We have developed a septile bin analysis to show these trends over time. Each bin serves a function.
< -10mph
This bin represents the percentage of drivers traveling more than 10mph below the posted speed limit and can indicate obstructions to traffic or traffic conflicts close to the enforcement zone. For our cameras, there may be an opportunity to optimize the placement of these devices to capture more free-flowing traffic.
-10 to +/-0mph
This bin represents safe driver behavior below the speed limit. The goal of the Automated Speed Enforcement program is for more drivers to be aware of their speed and operating their vehicle in a safe manner.
+/-0 to +10mph
This bin represents drivers traveling above the speed limit who are not eligible to receive an Automated Speed enforcement infraction. We do expect a change in driver behavior at this threshold due to enforcement, but we do like to see driver behavior shifting to lower speeds. We may benefit from 5mph interval bins to better understand driver behavior within this range.
+10 to +20mph
This bin represents drivers exhibiting excessive speed. This is the first threshold at which ASE citations are issued and we expect to see enforcement affect driver behavior.
+20mph and beyond
These bins represent dangerous and reckless driving behavior. We expect to see a reduction in all of these bins with enforcement but we also expect drivers exhibiting this behavior to be the most resistant to public safety initiatives, especially if these extreme speed events are recorded in the commission of other crimes.
Passing Values
Passing values are presented as a percentage to normalize the data to show variation in behavior over time. Safer driver behavior over time is a desirable outcome of automated speed enforcement programs. Values are rounded to two decimal places.
Data by Camera
Select the camera data you would like to see. Use the scroll bar at the bottom of each table to scroll sideways on smaller screens.
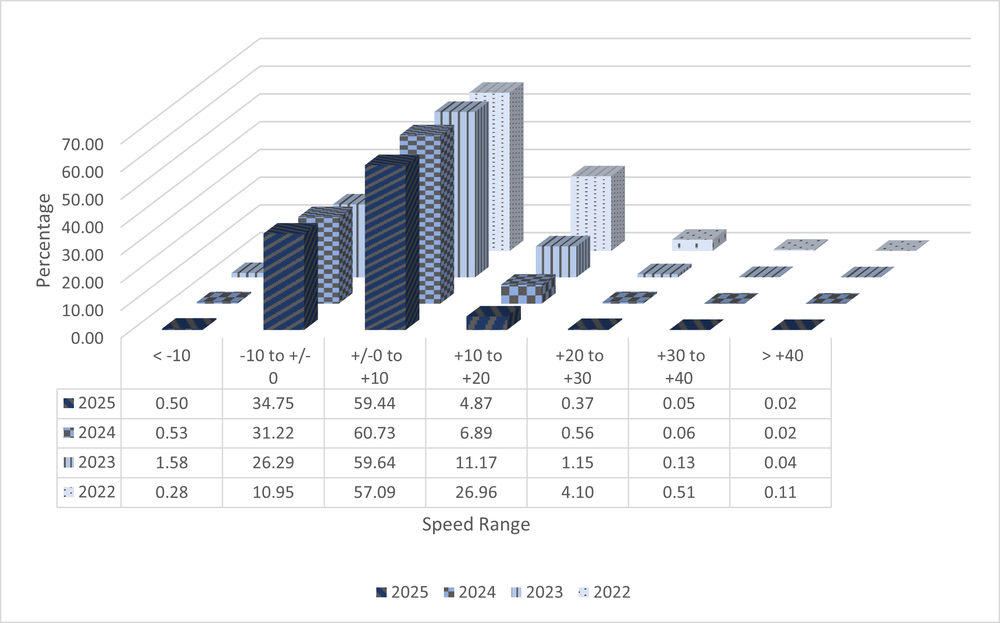
Speed limit: 40 MPH
% Reduction in Enforceable events: 83.23
| Time Frame | Count | < -10 | -10 to +/-0 | +/-0 to +10 | +10 to +20 | +20 to +30 | +30 to +40 | > +40 | Cumulative % of Enforceable Passing Events |
|---|---|---|---|---|---|---|---|---|---|
| 2022 Percent | 100.00 | 0.28 | 10.95 | 57.09 | 26.96 | 4.10 | 0.51 | 0.11 | 31.68 |
| 2023 Percent | 100.00 | 1.58 | 26.29 | 59.64 | 11.17 | 1.154 | 0.13 | 0.04 | 12.49 |
| 2024 Percent | 100.00 | 0.53 | 31.22 | 60.73 | 6.89 | 0.56 | 0.065 | 0.021 | 7.53 |
| 2025 Percent | 100.00 | 0.50 | 34.75 | 59.44 | 4.88 | 0.37 | 0.05 | 0.02 | 5.31 |
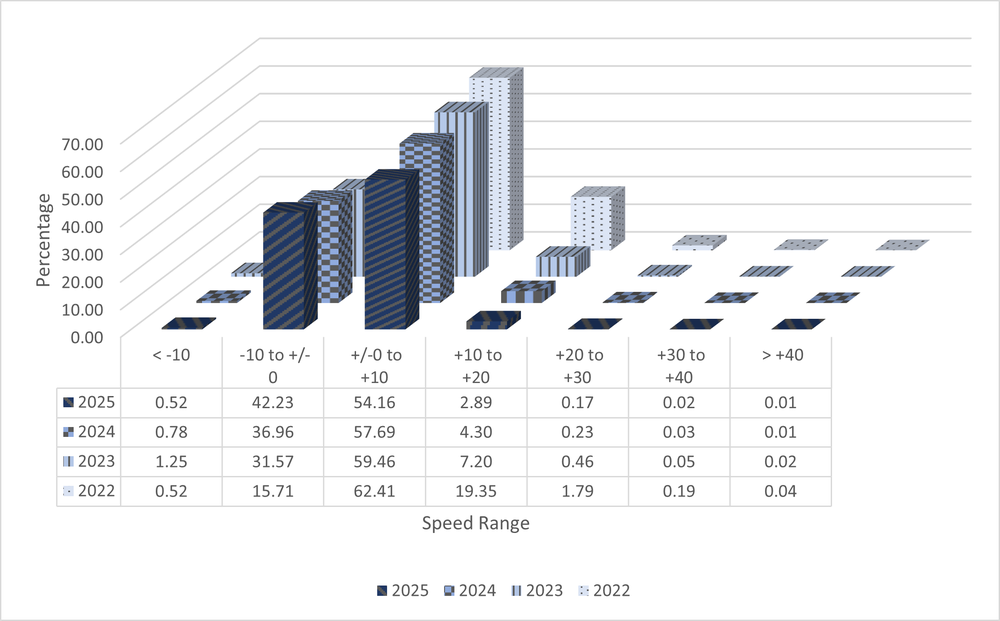
Speed limit: 40 MPH
% Reduction in Enforceable events: 85.52
| Time Frame | Count | < -10 | -10 to +/-0 | +/-0 to +10 | +10 to +20 | +20 to +30 | +30 to +40 | > +40 | Cumulative % of Enforceable Passing Events |
|---|---|---|---|---|---|---|---|---|---|
| 2022 Percent | 100.00 | 0.52 | 15.71 | 62.41 | 19.35 | 1.79 | 0.19 | 0.04 | 21.36 |
| 2023 Percent | 100.00 | 1.25 | 31.57 | 59.46 | 7.20 | 0.46 | 0.05 | 0.02 | 7.72 |
| 2024 Percent | 100.00 | 0.78 | 36.96 | 57.69 | 4.30 | 0.23 | 0.03 | 0.01 | 4.58 |
| 2025 Percent | 100.00 | 0.52 | 42.23 | 54.16 | 2.89 | 0.17 | 0.02 | 0.01 | 3.09 |
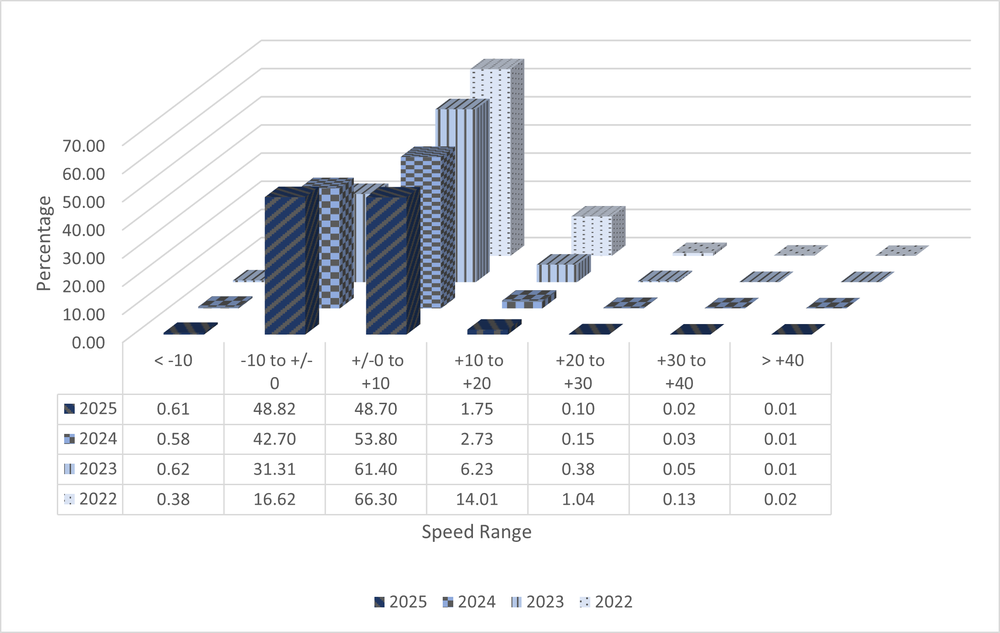
Speed limit: 40 MPH
% Reduction in Enforceable events: 87.66
| Time Frame | Count | < -10 | -10 to +/-0 | +/-0 to +10 | +10 to +20 | +20 to +30 | +30 to +40 | > +40 | Cumulative % of Enforceable Passing Events |
|---|---|---|---|---|---|---|---|---|---|
| 2022 Percent | 100.00 | 0.38 | 16.62 | 66.30 | 14.01 | 1.04 | 0.13 | 0.02 | 15.21 |
| 2023 Percent | 100.00 | 0.62 | 31.31 | 61.40 | 6.23 | 0.38 | 0.05 | 0.01 | 6.67 |
| 2024 Percent | 100.00 | 0.58 | 42.70 | 53.80 | 2.73 | 0.15 | 0.03 | 0.01 | 2.93 |
| 2025 Percent | 100.00 | 0.61 | 48.82 | 48.70 | 1.75 | 0.10 | 0.02 | 0.01 | 1.88 |
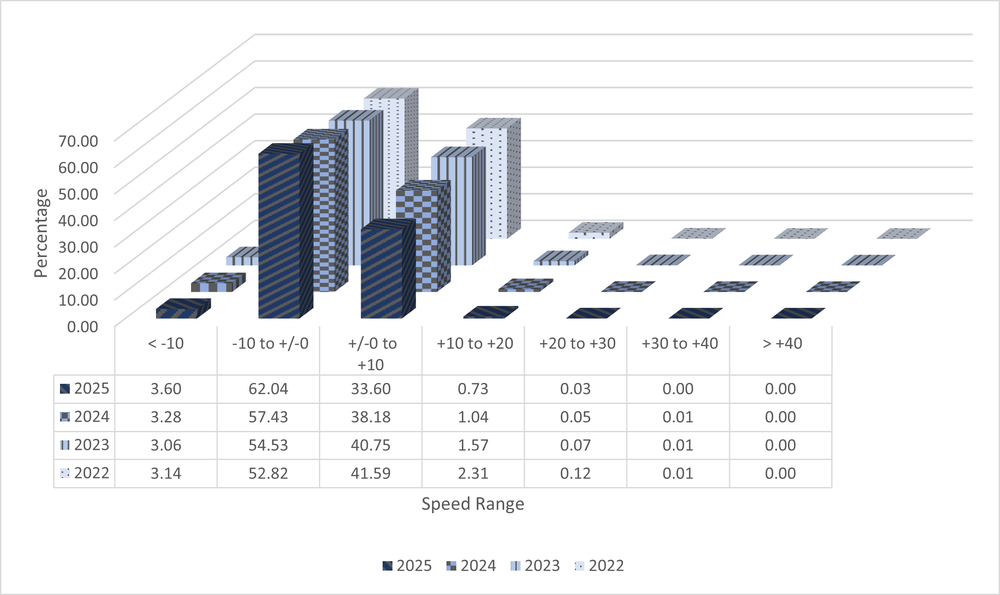
Speed limit: 30 MPH
% Reduction in Enforceable events: 68.78
| Time Frame | Count | < -10 | -10 to +/-0 | +/-0 to +10 | +10 to +20 | +20 to +30 | +30 to +40 | > +40 | Cumulative % of Enforceable Passing Events |
|---|---|---|---|---|---|---|---|---|---|
| 2022 Percent | 100.00 | 3.14 | 52.82 | 41.59 | 2.31 | 0.12 | 0.01 | 0.00 | 2.45 |
| 2023 Percent | 100.00 | 3.06 | 54.53 | 40.75 | 1.57 | 0.07 | 0.01 | 0.00 | 1.66 |
| 2024 Percent | 100.00 | 3.28 | 57.43 | 38.18 | 1.04 | 0.05 | 0.01 | 0.00 | 1.10 |
| 2025 Percent | 100.00 | 3.60 | 62.04 | 33.60 | 0.73 | 0.03 | 0.00 | 0.00 | 0.76 |
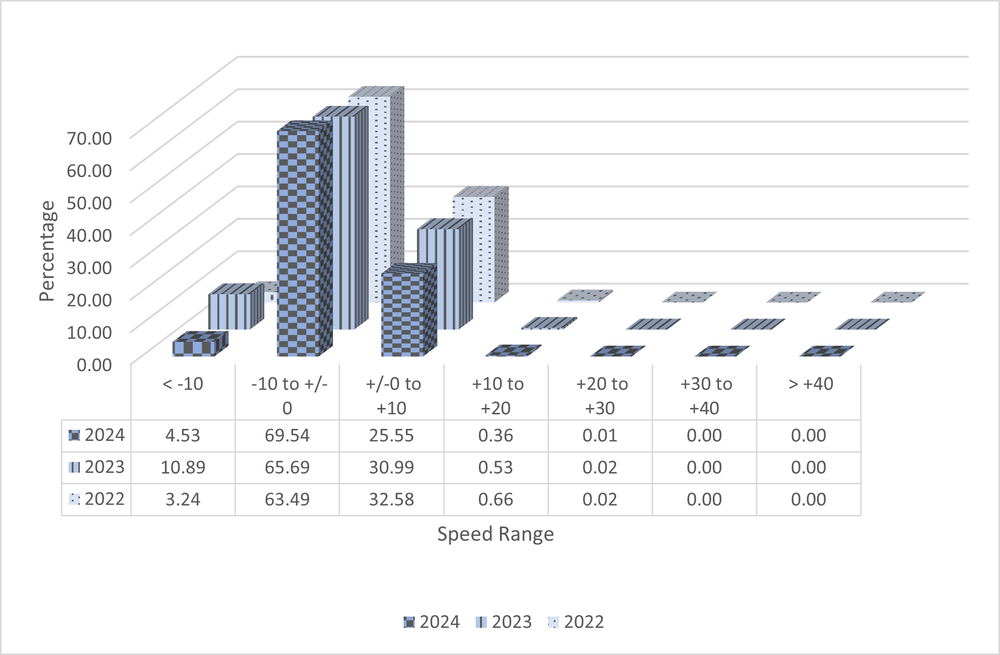
Speed limit: 30 MPH
% Reduction in Enforceable events: 44.93
| Time Frame | Count | < -10 | -10 to +/-0 | +/-0 to +10 | +10 to +20 | +20 to +30 | +30 to +40 | > +40 | Cumulative % of Enforceable Passing Events |
|---|---|---|---|---|---|---|---|---|---|
| 2022 Percent | 100.00 | 3.24 | 63.49 | 32.58 | 0.66 | 0.02 | 0.00 | 0.00 | 0.69 |
| 2023 Percent | 100.00 | 10.89 | 65.69 | 30.99 | 0.53 | 0.02 | 0.00 | 0.00 | 0.55 |
| 2024 Percent | 100.00 | 4.53 | 69.54 | 25.55 | 0.36 | 0.01 | 0.00 | 0.00 | 0.38 |
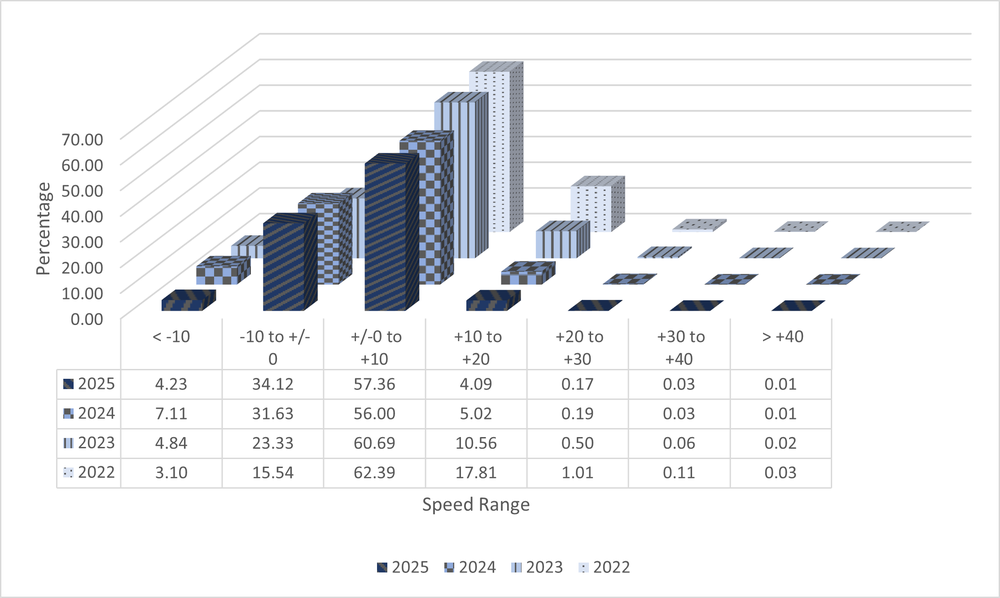
Speed limit: 30 MPH
% Reduction in Enforceable events: 77.35
| Time Frame | Count | < -10 | -10 to +/-0 | +/-0 to +10 | +10 to +20 | +20 to +30 | +30 to +40 | > +40 | Cumulative % of Enforceable Passing Events |
|---|---|---|---|---|---|---|---|---|---|
| 2022 Percent | 100.00 | 3.10 | 15.54 | 62.39 | 17.81 | 1.01 | 0.11 | 0.03 | 18.97 |
| 2023 Percent | 100.00 | 4.84 | 23.33 | 60.69 | 10.56 | 0.50 | 0.06 | 0.02 | 11.14 |
| 2024 Percent | 100.00 | 7.11 | 31.63 | 56.00 | 5.02 | 0.19 | 0.03 | 0.01 | 5.26 |
| 2025 Percent | 100.00 | 4.23 | 34.12 | 57.36 | 4.09 | 0.17 | 0.03 | 0.01 | 4.30 |
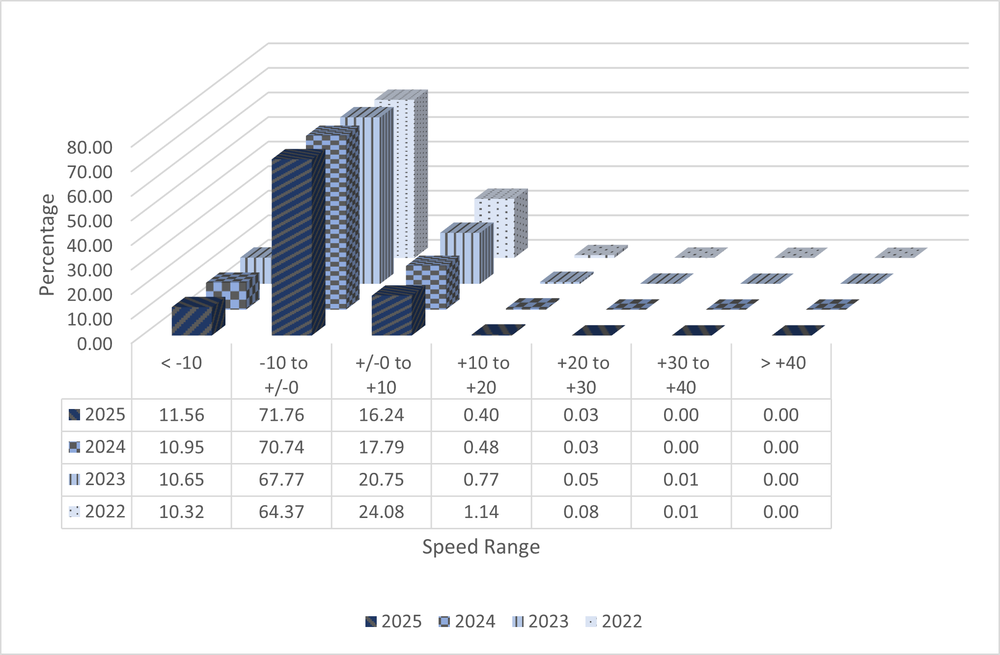
Speed limit: 40 MPH
% Reduction in Enforceable events: 64.76
| Time Frame | Count | < -10 | -10 to +/-0 | +/-0 to +10 | +10 to +20 | +20 to +30 | +30 to +40 | > +40 | Cumulative % of Enforceable Passing Events |
|---|---|---|---|---|---|---|---|---|---|
| 2022 Percent | 100.00 | 10.32 | 64.37 | 24.08 | 1.14 | 0.08 | 0.01 | 0.00 | 1.23 |
| 2023 Percent | 100.00 | 10.65 | 67.77 | 20.75 | 0.77 | 0.05 | 0.01 | 0.00 | 0.82 |
| 2024 Percent | 100.00 | 10.95 | 70.74 | 17.79 | 0.48 | 0.03 | 0.00 | 0.00 | 0.52 |
| 2025 Percent | 100.00 | 11.56 | 71.76 | 16.24 | 0.40 | 0.03 | 0.00 | 0.00 | 0.43 |
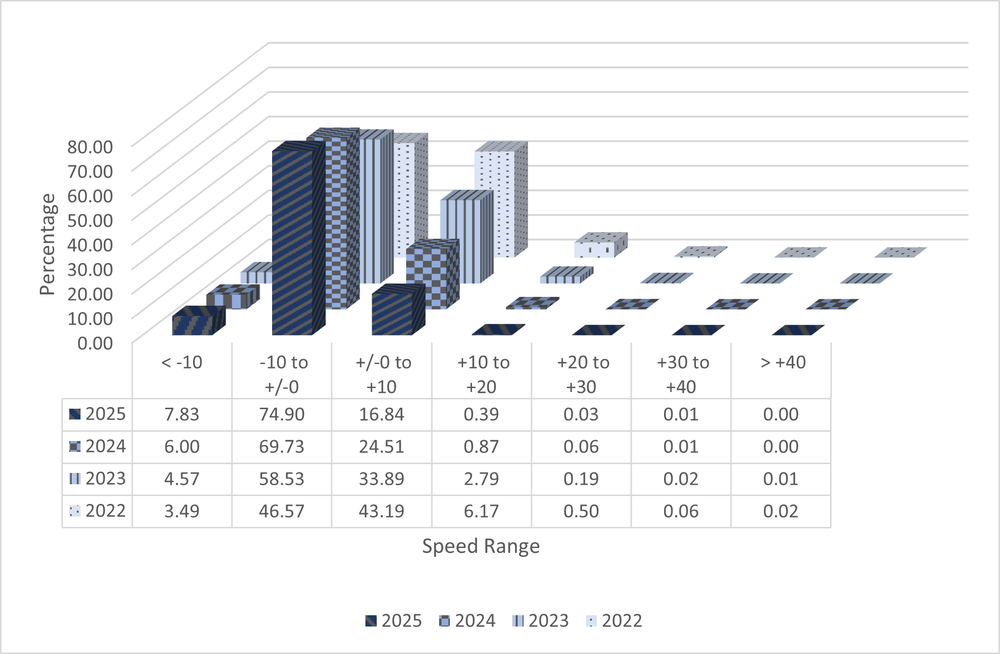
Speed limit: 45 MPH
% Reduction in Enforceable events: 93.67
| Time Frame | Count | < -10 | -10 to +/-0 | +/-0 to +10 | +10 to +20 | +20 to +30 | +30 to +40 | > +40 | Cumulative % of Enforceable Passing Events |
|---|---|---|---|---|---|---|---|---|---|
| 2022 Percent | 100.00 | 3.49 | 46.57 | 43.19 | 6.17 | 0.50 | 0.06 | 0.02 | 6.75 |
| 2023 Percent | 100.00 | 4.57 | 58.53 | 33.89 | 2.79 | 0.19 | 0.02 | 0.01 | 3.01 |
| 2024 Percent | 100.00 | 6.00 | 69.73 | 24.51 | 0.87 | 0.06 | 0.01 | 0.00 | 0.94 |
| 2025 Percent | 100.00 | 7.83 | 74.90 | 16.84 | 0.39 | 0.03 | 0.01 | 0.00 | 0.43 |
Speed limit: 40 MPH
% Reduction in Enforceable events: 78.48
| Time Frame | Count | < -10 | -10 to +/-0 | +/-0 to +10 | +10 to +20 | +20 to +30 | +30 to +40 | > +40 | Cumulative % of Enforceable Passing Events |
|---|---|---|---|---|---|---|---|---|---|
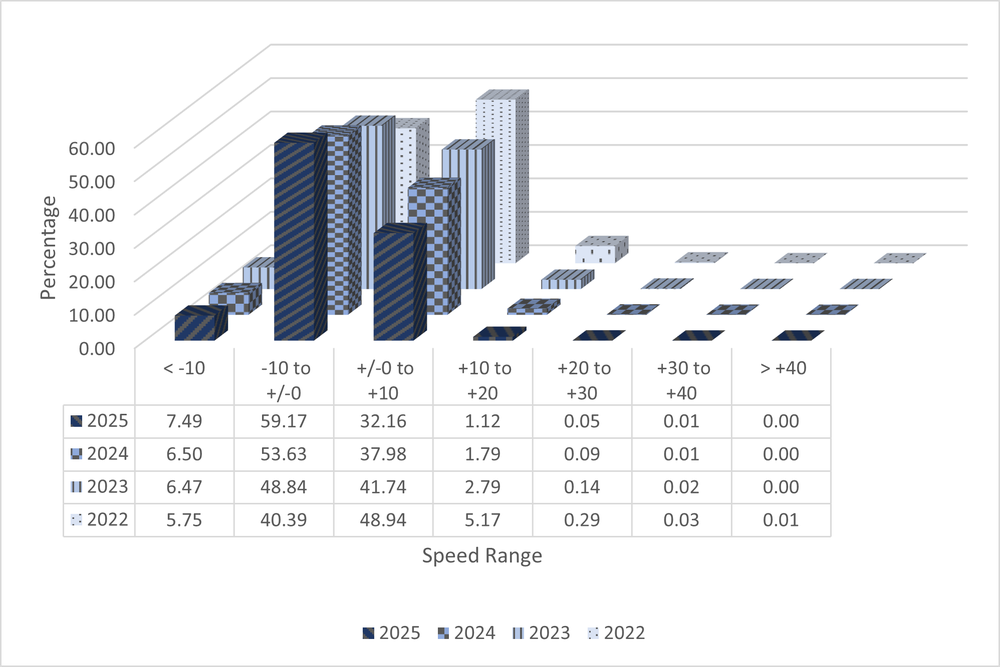
| 2022 Percent | 100.00 | 5.75 | 40.39 | 48.94 | 5.17 | 0.29 | 0.03 | 0.01 | 5.49 |
| 2023 Percent | 100.00 | 6.47 | 48.84 | 41.74 | 2.79 | 0.14 | 0.02 | 0.00 | 2.95 |
| 2024 Percent | 100.00 | 6.50 | 53.63 | 37.98 | 1.79 | 0.09 | 0.01 | 0.00 | 1.89 |
| 2025 Percent | 100.00 | 7.49 | 59.17 | 32.16 | 1.12 | 0.05 | 0.01 | 0.00 | 1.18 |
Speed limit: 40 MPH
% Reduction in Enforceable events: 92.53
| Time Frame | Count | < -10 | -10 to +/-0 | +/-0 to +10 | +10 to +20 | +20 to +30 | +30 to +40 | > +40 | Cumulative % of Enforceable Passing Events |
|---|---|---|---|---|---|---|---|---|---|
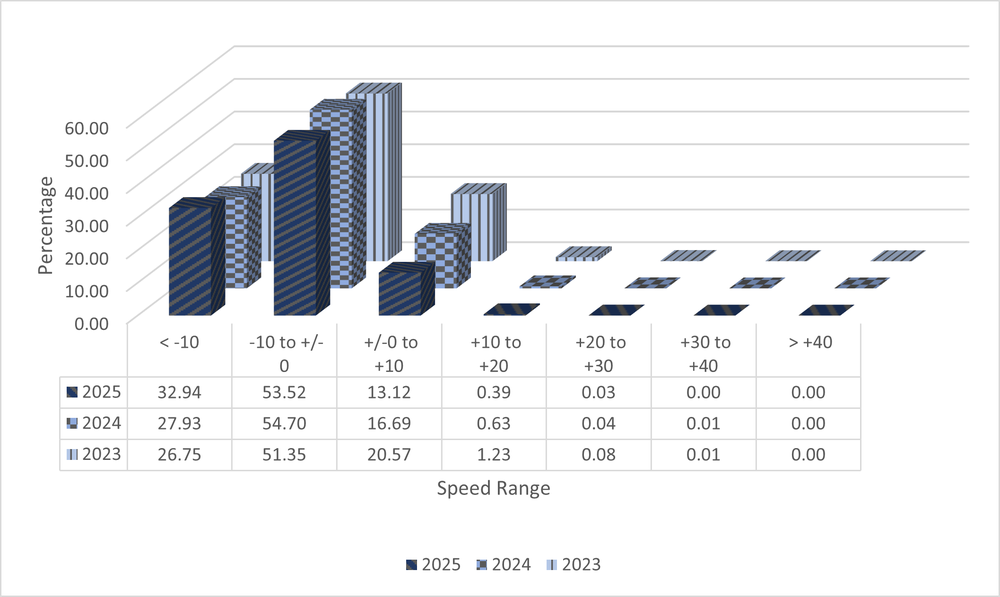
| 2023 Percent | 100.00 | 26.75 | 51.35 | 20.57 | 1.23 | 0.08 | 0.01 | 0.00 | 1.33 |
| 2024 Percent | 100.00 | 27.93 | 54.70 | 16.69 | 0.63 | 0.04 | 0.01 | 0.00 | 0.68 |
| 2025 Percent | 100.00 | 32.94 | 53.52 | 13.12 | 0.39 | 0.03 | 0.00 | 0.00 | 0.43 |
Speed limit: 35 MPH
% Reduction in Enforceable events: 60.16
| Time Frame | Count | < -10 | -10 to +/-0 | +/-0 to +10 | +10 to +20 | +20 to +30 | +30 to +40 | > +40 | Cumulative % of Enforceable Passing Events |
|---|---|---|---|---|---|---|---|---|---|
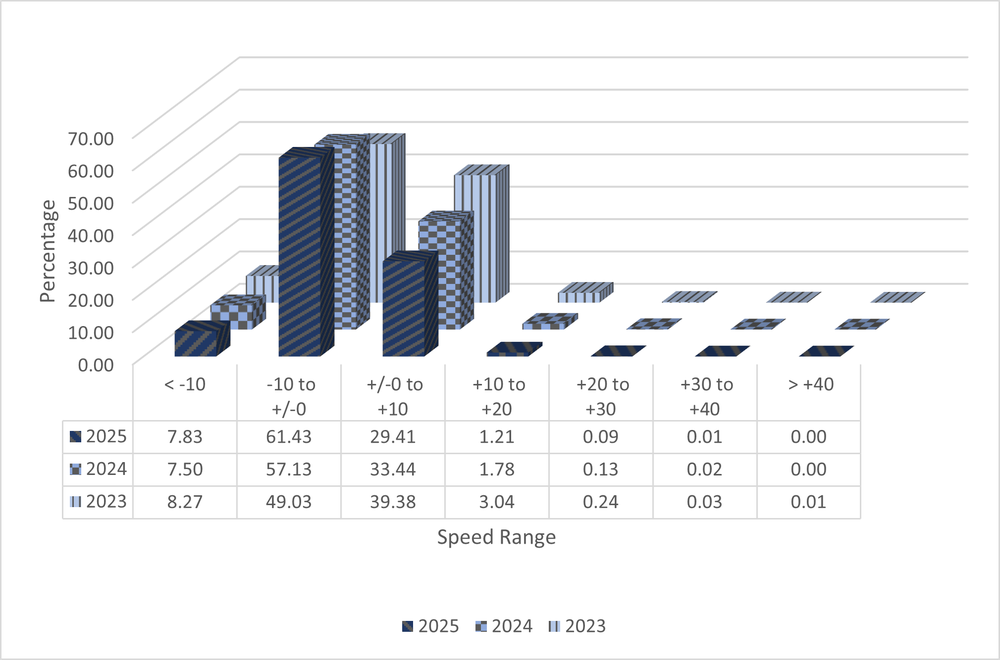
| 2023 Percent | 100.00 | 8.27 | 49.03 | 39.38 | 3.04 | 0.24 | 0.03 | 0.01 | 3.33 |
| 2024 Percent | 100.00 | 7.50 | 57.13 | 33.44 | 1.78 | 0.13 | 0.02 | 0.00 | 1.94 |
| 2025 Percent | 100.00 | 7.83 | 61.43 | 29.41 | 1.21 | 0.09 | 0.01 | 0.00 | 1.32 |
Speed limit: 30 MPH
% Reduction in Enforceable events: 52.44
| Time Frame | Count | < -10 | -10 to +/-0 | +/-0 to +10 | +10 to +20 | +20 to +30 | +30 to +40 | > +40 | Cumulative % of Enforceable Passing Events |
|---|---|---|---|---|---|---|---|---|---|
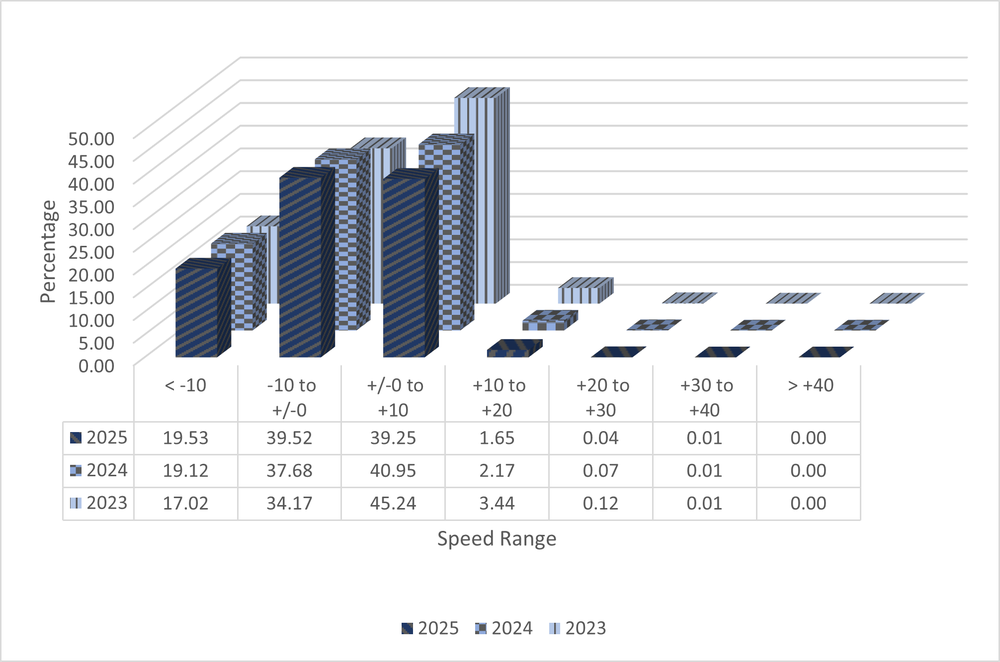
| 2023 Percent | 100.00 | 17.02 | 34.17 | 45.24 | 3.44 | 0.12 | 0.01 | 0.00 | 3.57 |
| 2024 Percent | 100.00 | 19.12 | 37.68 | 40.95 | 2.17 | 0.07 | 0.01 | 0.00 | 2.25 |
| 2025 Percent | 100.00 | 19.53 | 39.52 | 39.25 | 1.65 | 0.04 | 0.01 | 0.00 | 1.70 |
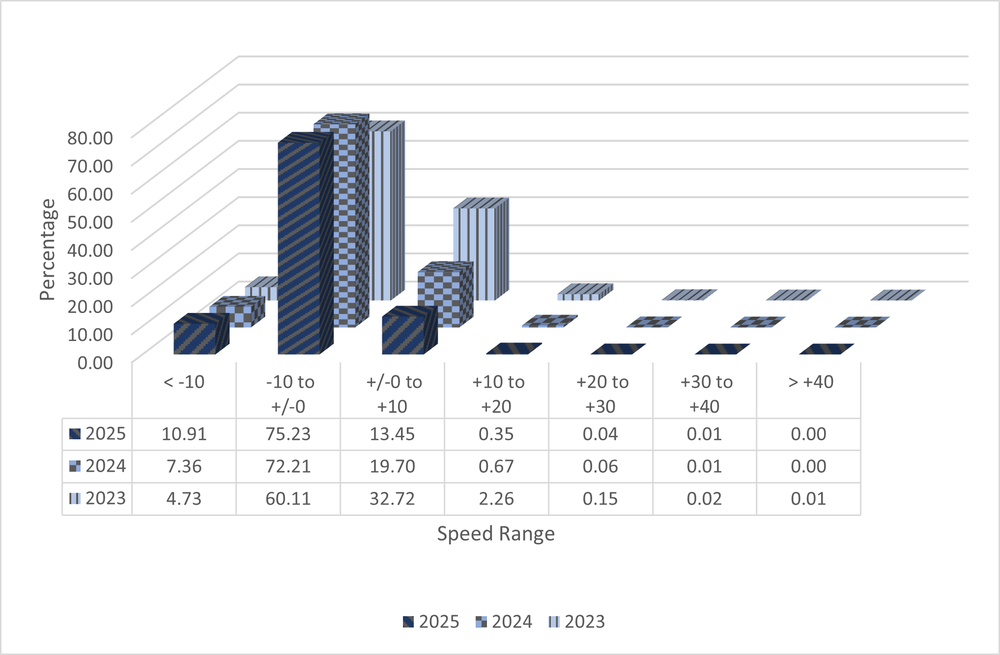
Speed limit: 45 MPH
% Reduction in Enforceable events: 83.40
| Time Frame | Count | < -10 | -10 to +/-0 | +/-0 to +10 | +10 to +20 | +20 to +30 | +30 to +40 | > +40 | Cumulative % of Enforceable Passing Events |
|---|---|---|---|---|---|---|---|---|---|
| 2023 Percent | 100.00 | 4.73 | 60.11 | 32.72 | 2.26 | 0.15 | 0.02 | 0.01 | 2.44 |
| 2024 Percent | 100.00 | 7.36 | 72.21 | 19.70 | 0.67 | 0.06 | 0.01 | 0.00 | 0.74 |
| 2025 Percent | 100.00 | 10.91 | 75.23 | 13.45 | 0.35 | 0.04 | 0.01 | 0.00 | 0.40 |
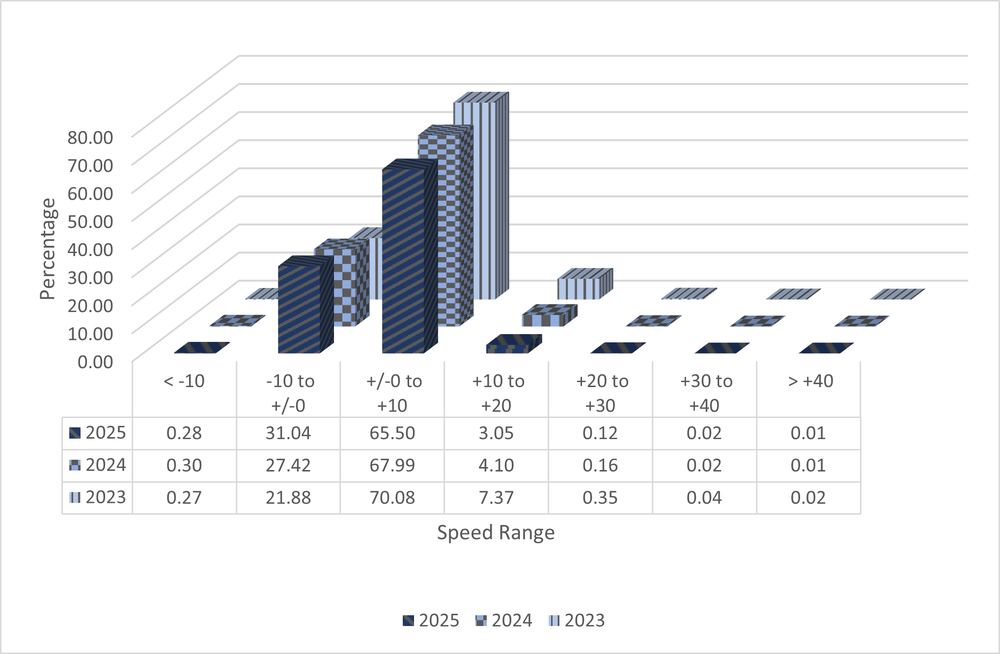
Speed limit: 40 MPH
% Reduction in Enforceable events: 59.01
| Time Frame | Count | < -10 | -10 to +/-0 | +/-0 to +10 | +10 to +20 | +20 to +30 | +30 to +40 | > +40 | Cumulative % of Enforceable Passing Events |
|---|---|---|---|---|---|---|---|---|---|
| 2023 Percent | 100.00 | 0.27 | 21.88 | 70.08 | 7.37 | 0.35 | 0.04 | 0.02 | 7.78 |
| 2024 Percent | 100.00 | 0.30 | 27.42 | 67.99 | 4.10 | 0.16 | 0.02 | 0.01 | 4.30 |
| 2025 Percent | 100.00 | 0.28 | 31.04 | 65.50 | 3.05 | 0.12 | 0.02 | 0.01 | 3.19 |
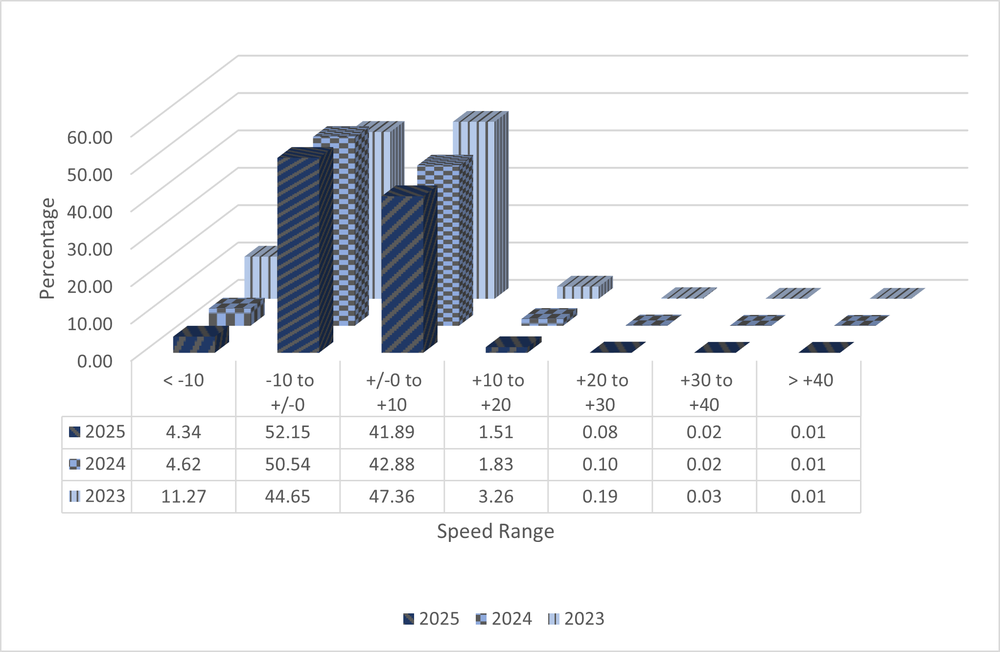
Speed limit: 40 MPH
% Reduction in Enforceable events: 53.68
| Time Frame | Count | < -10 | -10 to +/-0 | +/-0 to +10 | +10 to +20 | +20 to +30 | +30 to +40 | > +40 | Cumulative % of Enforceable Passing Events |
|---|---|---|---|---|---|---|---|---|---|
| 2023 Percent | 100.00 | 11.27 | 44.65 | 47.36 | 3.26 | 0.19 | 0.03 | 0.01 | 3.49 |
| 2024 Percent | 100.00 | 4.62 | 50.54 | 42.88 | 1.83 | 0.10 | 0.02 | 0.01 | 1.96 |
| 2025 Percent | 100.00 | 4.34 | 52.15 | 41.89 | 1.51 | 0.08 | 0.02 | 0.01 | 1.62 |
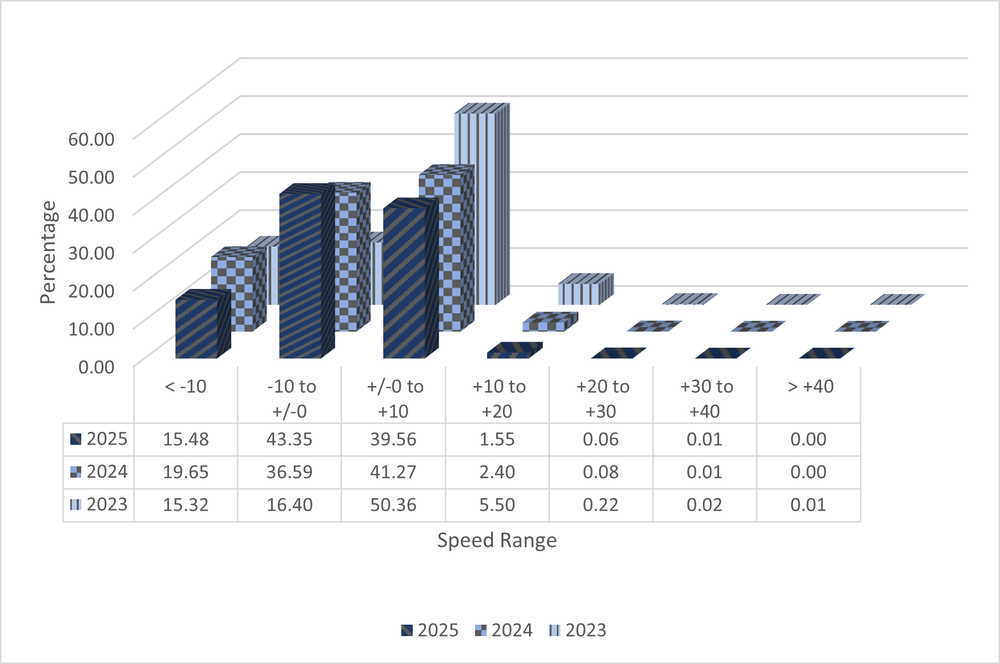
Speed limit: 40 MPH
% Reduction in Enforceable events: 71.88
| Time Frame | Count | < -10 | -10 to +/-0 | +/-0 to +10 | +10 to +20 | +20 to +30 | +30 to +40 | > +40 | Cumulative % of Enforceable Passing Events |
|---|---|---|---|---|---|---|---|---|---|
| 2023 Percent | 100.00 | 15.32 | 16.40 | 50.36 | 5.50 | 0.22 | 0.02 | 0.01 | 5.75 |
| 2024 Percent | 100.00 | 19.65 | 36.59 | 41.27 | 2.40 | 0.08 | 0.01 | 0.00 | 2.50 |
| 2025 Percent | 100.00 | 15.48 | 43.35 | 39.56 | 1.55 | 0.06 | 0.01 | 0.00 | 1.62 |
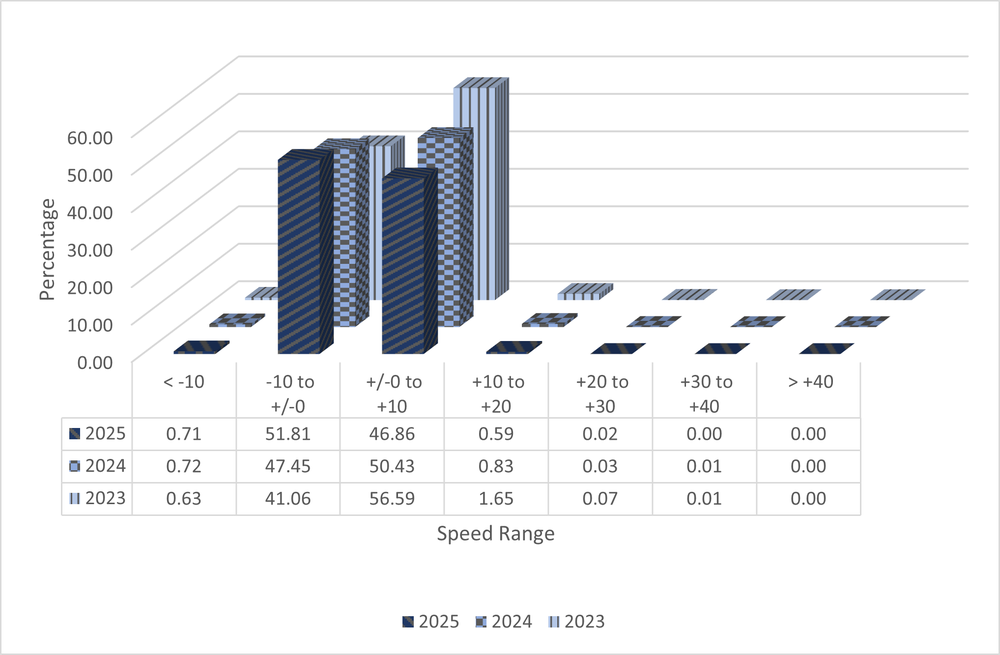
Speed limit: 40 MPH
% Reduction in Enforceable events: 64.19
| Time Frame | Count | < -10 | -10 to +/-0 | +/-0 to +10 | +10 to +20 | +20 to +30 | +30 to +40 | > +40 | Cumulative % of Enforceable Passing Events |
|---|---|---|---|---|---|---|---|---|---|
| 2023 Percent | 100.00 | 0.63 | 41.06 | 56.59 | 1.65 | 0.07 | 0.01 | 0.00 | 1.73 |
| 2024 Percent | 100.00 | 0.72 | 47.45 | 50.43 | 0.83 | 0.03 | 0.01 | 0.00 | 0.87 |
| 2025 Percent | 100.00 | 0.71 | 51.81 | 46.86 | 0.59 | 0.02 | 0.00 | 0.00 | 0.62 |
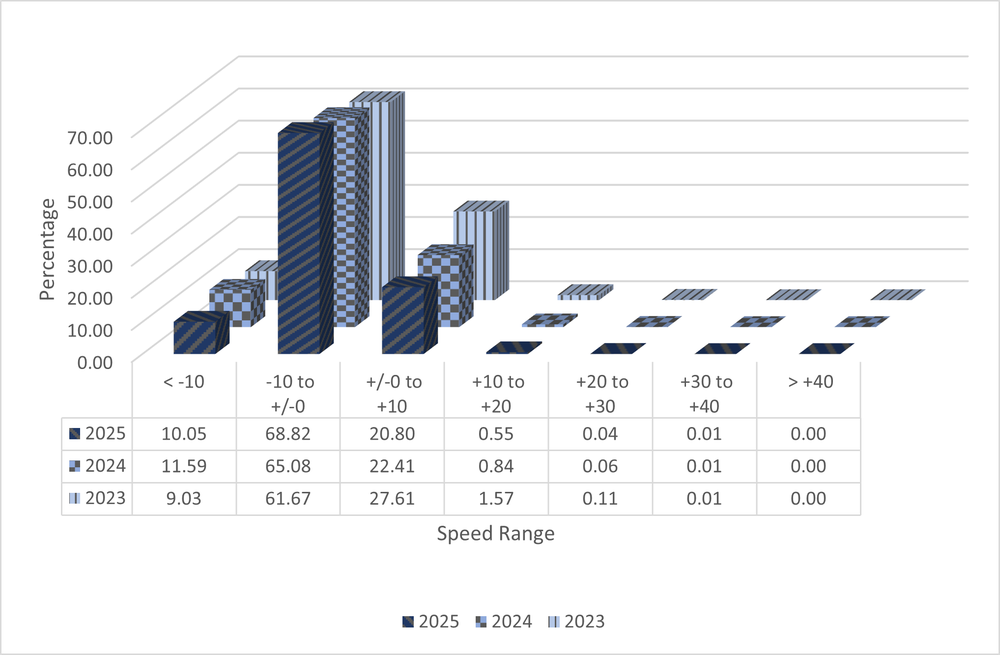
Speed limit: 45 MPH
% Reduction in Enforceable events: 64.84
| Time Frame | Count | < -10 | -10 to +/-0 | +/-0 to +10 | +10 to +20 | +20 to +30 | +30 to +40 | > +40 | Cumulative % of Enforceable Passing Events |
|---|---|---|---|---|---|---|---|---|---|
| 2023 Percent | 100.00 | 9.03 | 61.67 | 27.61 | 1.57 | 0.11 | 0.01 | 0.00 | 1.70 |
| 2024 Percent | 100.00 | 11.59 | 65.08 | 22.41 | 0.84 | 0.06 | 0.01 | 0.00 | 0.92 |
| 2025 Percent | 100.00 | 10.05 | 68.82 | 20.80 | 0.55 | 0.04 | 0.01 | 0.00 | 0.60 |
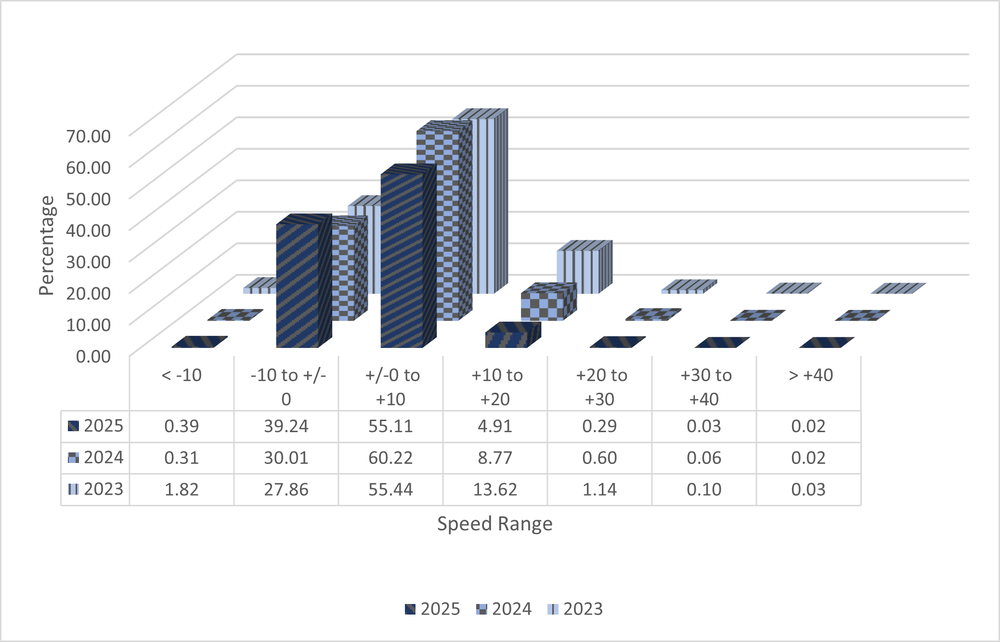
Speed limit: 45 MPH
% Reduction in Enforceable events: 64.65
| Time Frame | Count | < -10 | -10 to +/-0 | +/-0 to +10 | +10 to +20 | +20 to +30 | +30 to +40 | > +40 | Cumulative % of Enforceable Passing Events |
|---|---|---|---|---|---|---|---|---|---|
| 2023 Percent | 100.00 | 1.82 | 27.86 | 55.44 | 13.62 | 1.14 | 0.10 | 0.03 | 14.88 |
| 2024 Percent | 100.00 | 0.31 | 30.01 | 60.22 | 8.77 | 0.60 | 0.06 | 0.02 | 9.45 |
| 2025 Percent | 100.00 | 0.39 | 39.24 | 55.11 | 4.91 | 0.29 | 0.03 | 0.02 | 5.26 |
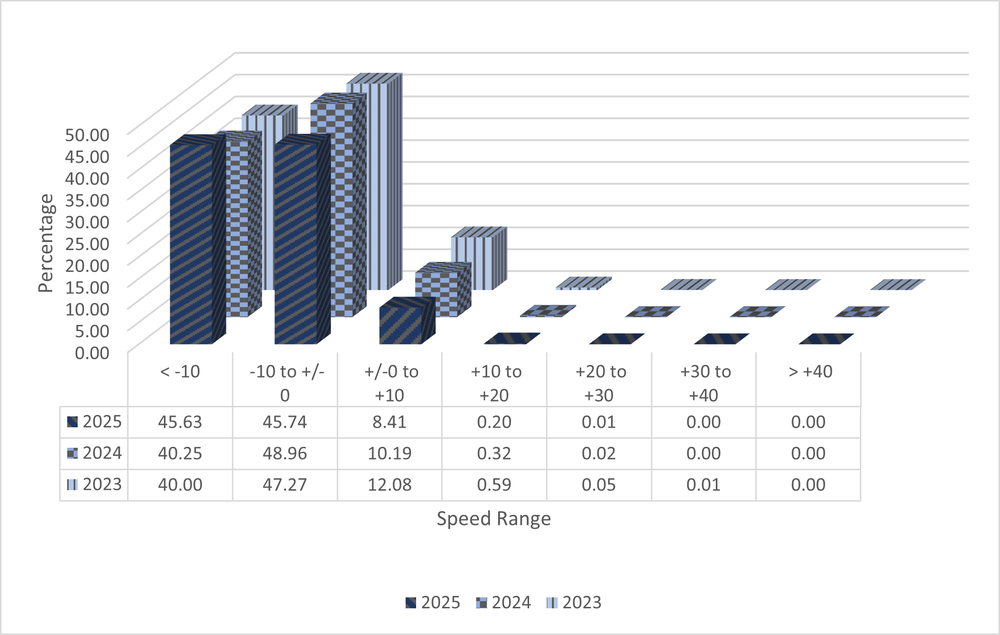
Speed limit: 55 MPH
% Reduction in Enforceable events: 66.97
| Time Frame | Count | < -10 | -10 to +/-0 | +/-0 to +10 | +10 to +20 | +20 to +30 | +30 to +40 | > +40 | Cumulative % of Enforceable Passing Events |
|---|---|---|---|---|---|---|---|---|---|
| 2023 Percent | 100.00 | 40.00 | 47.27 | 12.08 | 0.59 | 0.05 | 0.01 | 0.00 | 0.65 |
| 2024 Percent | 100.00 | 40.25 | 48.96 | 10.19 | 0.32 | 0.02 | 0.00 | 0.00 | 0.35 |
| 2025 Percent | 100.00 | 45.63 | 45.74 | 8.41 | 0.20 | 0.01 | 0.00 | 0.00 | 0.21 |
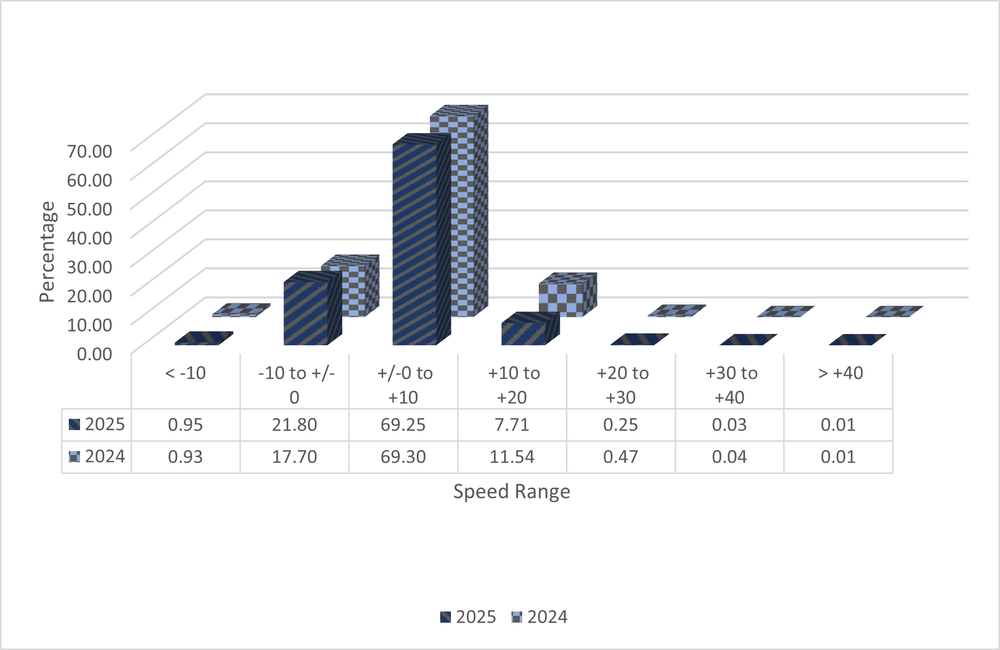
Speed limit: 30 MPH
% Reduction in Enforceable events: 33.73
| Time Frame | Count | < -10 | -10 to +/-0 | +/-0 to +10 | +10 to +20 | +20 to +30 | +30 to +40 | > +40 | Cumulative % of Enforceable Passing Events |
|---|---|---|---|---|---|---|---|---|---|
| 2024 Percent | 100.00 | 0.93 | 17.70 | 69.30 | 11.54 | 0.47 | 0.04 | 0.01 | 12.06 |
| 2025 Percent | 100.00 | 0.95 | 21.80 | 69.25 | 7.71 | 0.25 | 0.03 | 0.01 | 8.00 |