Unbanked Household Comparison Graph
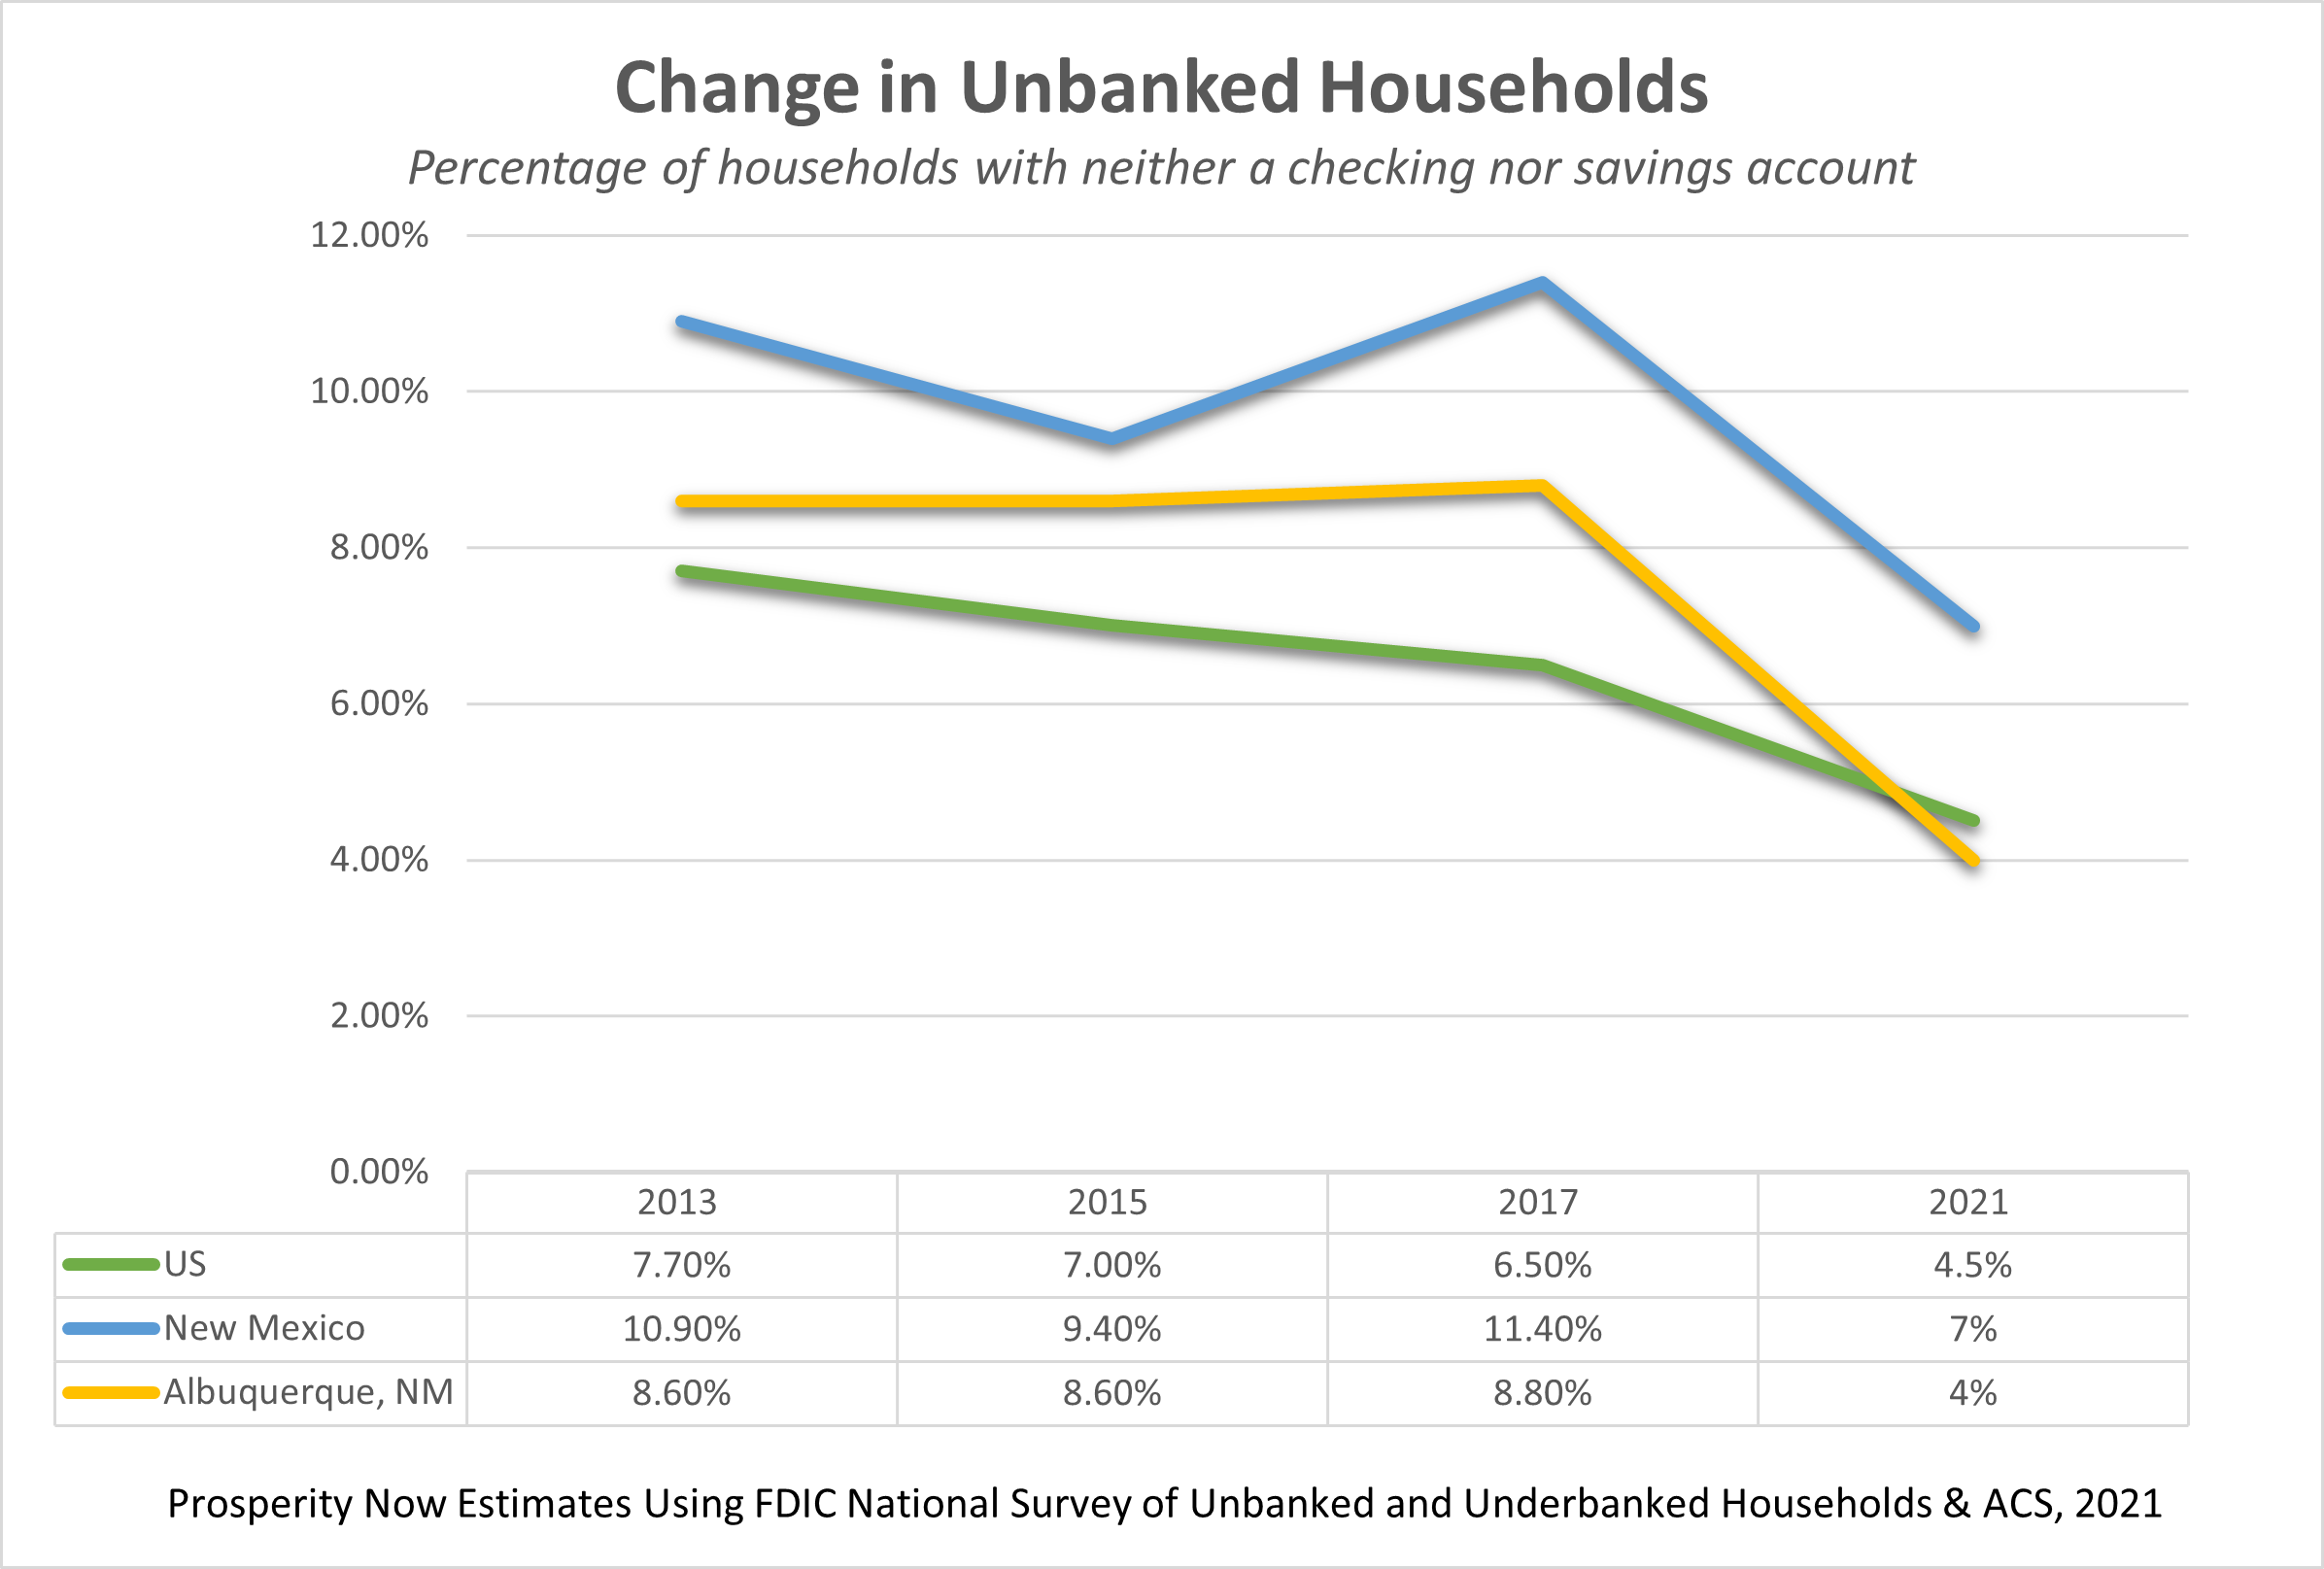
A graph that shows the comparison of unbanked households for the US, New Mexico, and Albuquerque. The chart compares the percent of households who are unbanked from years 2013 - 2021.


A graph that shows the comparison of unbanked households for the US, New Mexico, and Albuquerque. The chart compares the percent of households who are unbanked from years 2013 - 2021.
